


Table of Contents
UNITED STATES
SECURITIES AND EXCHANGE COMMISSION
Washington, D.C. 20549
FORM 10-K
(Mark One)
☑ ANNUAL REPORT PURSUANT TO SECTION 13 OR 15(D) OF THE SECURITIES EXCHANGE ACT OF 1934
FOR THE FISCAL YEAR ENDED MAY 31, 2023
OR
☐ TRANSITION REPORT PURSUANT TO SECTION 13 OR 15(D) OF THE SECURITIES EXCHANGE ACT OF 1934
FOR THE TRANSITION PERIOD FROM TO .
Commission File No. 1-10635
NIKE, Inc.
(Exact name of Registrant as specified in its charter)
| Oregon | 93-0584541 | ||||||||||
| (State or other jurisdiction of incorporation) | (IRS Employer Identification No.) | ||||||||||
One Bowerman Drive, Beaverton, Oregon 97005-6453
(Address of principal executive offices and zip code)
(503) 671-6453
(Registrant’s telephone number, including area code)
| SECURITIES REGISTERED PURSUANT TO SECTION 12(B) OF THE ACT: | |||||||||||
| Class B Common Stock | NKE | New York Stock Exchange | |||||||||
| (Title of each class) | (Trading symbol) | (Name of each exchange on which registered) | |||||||||
| SECURITIES REGISTERED PURSUANT TO SECTION 12(G) OF THE ACT: | |||||||||||
| NONE | |||||||||||
| Indicate by check mark: | YES | NO | |||||||||||||||||||||||||||||||||
| • | if the registrant is a well-known seasoned issuer, as defined in Rule 405 of the Securities Act. | þ | ¨ | ||||||||||||||||||||||||||||||||
| • | if the registrant is not required to file reports pursuant to Section 13 or Section 15(d) of the Act. | ¨ | þ | ||||||||||||||||||||||||||||||||
| • | whether the registrant (1) has filed all reports required to be filed by Section 13 or 15(d) of the Securities Exchange Act of 1934 during the preceding 12 months (or for such shorter period that the registrant was required to file such reports), and (2) has been subject to such filing requirements for the past 90 days. | þ | ¨ | ||||||||||||||||||||||||||||||||
| • | whether the registrant has submitted electronically every Interactive Data File required to be submitted pursuant to Rule 405 of Regulation S-T (§232.405 of this chapter) during the preceding 12 months (or for such shorter period that the registrant was required to submit such files). | þ | ¨ | ||||||||||||||||||||||||||||||||
| • | whether the registrant is a large accelerated filer, an accelerated filer, a non-accelerated filer, a smaller reporting company or an emerging growth company. See the definitions of “large accelerated filer,” “accelerated filer,” “smaller reporting company,” and “emerging growth company” in Rule 12b-2 of the Exchange Act. | ||||||||||||||||||||||||||||||||||
| Large accelerated filer | þ | Accelerated filer | ☐ | Non-accelerated filer | ☐ | Smaller reporting company | ☐ | Emerging growth company | ☐ | ||||||||||||||||||||||||||
| • | if an emerging growth company, if the registrant has elected not to use the extended transition period for complying with any new or revised financial accounting standards provided pursuant to Section 13(a) of the Exchange Act. | ¨ | |||||||||||||||||||||||||||||||||
| • | whether the registrant has filed a report on and attestation to its management’s assessment of the effectiveness of its internal control over financial reporting under Section 404(b) of the Sarbanes-Oxley Act (15 U.S.C. 7262(b)) by the registered public accounting firm that prepared or issued its audit report. | þ | |||||||||||||||||||||||||||||||||
| • | if securities are registered pursuant to Section 12(b) of the Act, whether the financial statements of the registrant included in the filing reflect the correction of an error to previously issued financial statements. | ¨ | |||||||||||||||||||||||||||||||||
| • | whether any of those error corrections are restatements that required a recovery analysis of incentive-based compensation received by any of the registrant’s executive officers during the relevant recovery period pursuant to § 240.10D-1(b). | ¨ | |||||||||||||||||||||||||||||||||
| • | whether the registrant is a shell company (as defined in Rule 12b-2 of the Act). | ☐ | þ | ||||||||||||||||||||||||||||||||
| As of November 30, 2022, the aggregate market values of the Registrant’s Common Stock held by non-affiliates were: | |||||
| Class A | $ | 7,831,564,572 | |||
| Class B | 136,467,702,472 | ||||
| $ | 144,299,267,044 | ||||
Table of Contents
| As of July 12, 2023, the number of shares of the Registrant’s Common Stock outstanding were: | |||||
| Class A | 304,897,252 | ||||
| Class B | 1,225,074,356 | ||||
| 1,529,971,608 | |||||
DOCUMENTS INCORPORATED BY REFERENCE:
Parts of Registrant’s Proxy Statement for the Annual Meeting of Shareholders to be held on September 12, 2023, are incorporated by reference into Part III of this report.
Table of Contents
NIKE, INC.
ANNUAL REPORT ON FORM 10-K
TABLE OF CONTENTS
| PAGE | ||||||||
| PART I | 1 | |||||||
| ITEM 1. | Business | 1 | ||||||
| General | 1 | |||||||
| Products | 1 | |||||||
| Sales and Marketing | 2 | |||||||
| Our Markets | 2 | |||||||
| Significant Customer | 3 | |||||||
| Product Research, Design and Development | 3 | |||||||
| Manufacturing | 3 | |||||||
| International Operations and Trade | 4 | |||||||
| Competition | 5 | |||||||
| Trademarks and Patents | 5 | |||||||
| Human Capital Resources | 6 | |||||||
| Available Information and Websites | 7 | |||||||
| Information about our Executive Officers | 8 | |||||||
| ITEM 1A. | Risk Factors | 9 | ||||||
| ITEM 1B. | Unresolved Staff Comments | 24 | ||||||
| ITEM 2. | Properties | 24 | ||||||
| ITEM 3. | Legal Proceedings | 24 | ||||||
| ITEM 4. | Mine Safety Disclosures | 24 | ||||||
| PART II | 25 | |||||||
| ITEM 5. | Market for Registrant’s Common Equity, Related Stockholder Matters and Issuer Purchases of Equity Securities | 25 | ||||||
| ITEM 6. | Reserved | 27 | ||||||
| ITEM 7. | Management’s Discussion and Analysis of Financial Condition and Results of Operations | 28 | ||||||
| ITEM 7A. | Quantitative and Qualitative Disclosures about Market Risk | 49 | ||||||
| ITEM 8. | Financial Statements and Supplementary Data | 51 | ||||||
| ITEM 9. | Changes in and Disagreements with Accountants on Accounting and Financial Disclosure | 91 | ||||||
| ITEM 9A. | Controls and Procedures | 91 | ||||||
| ITEM 9B. | Other Information | 91 | ||||||
| ITEM 9C. | Disclosure Regarding Foreign Jurisdictions that Prevent Inspections | 91 | ||||||
| PART III | 92 | |||||||
| (Except for the information set forth under “Information about our Executive Officers” in Item 1 above, Part III is incorporated by reference from the Proxy Statement for the NIKE, Inc. 2023 Annual Meeting of Shareholders.) | ||||||||
| ITEM 10. | Directors, Executive Officers and Corporate Governance | 92 | ||||||
| ITEM 11. | Executive Compensation | 92 | ||||||
| ITEM 12. | Security Ownership of Certain Beneficial Owners and Management and Related Stockholder Matters | 92 | ||||||
| ITEM 13. | Certain Relationships and Related Transactions and Director Independence | 92 | ||||||
| ITEM 14. | Principal Accountant Fees and Services | 92 | ||||||
| PART IV | 93 | |||||||
| ITEM 15. | Exhibits and Financial Statement Schedules | 93 | ||||||
| ITEM 16. | Form 10-K Summary | 97 | ||||||
| Signatures | 99 | |||||||
Table of Contents
PART I
ITEM 1. BUSINESS
GENERAL
NIKE, Inc. was incorporated in 1967 under the laws of the State of Oregon. As used in this Annual Report on Form 10-K (this “Annual Report”), the terms “we,” “us,” “our,” “NIKE” and the “Company” refer to NIKE, Inc. and its predecessors, subsidiaries and affiliates, collectively, unless the context indicates otherwise.
Our principal business activity is the design, development and worldwide marketing and selling of athletic footwear, apparel, equipment, accessories and services. NIKE is the largest seller of athletic footwear and apparel in the world. We sell our products through NIKE Direct operations, which are comprised of both NIKE-owned retail stores and sales through our digital platforms (also referred to as “NIKE Brand Digital”), to retail accounts and to a mix of independent distributors, licensees and sales representatives in nearly all countries around the world. We also offer interactive consumer services and experiences through our digital platforms. Nearly all of our products are manufactured by independent contractors. Nearly all footwear and apparel products are manufactured outside the United States, while equipment products are manufactured both in the United States and abroad.
All references to fiscal 2023, 2022, 2021 and 2020 are to NIKE, Inc.’s fiscal years ended May 31, 2023, 2022, 2021 and 2020, respectively. Any references to other fiscal years refer to a fiscal year ending on May 31 of that year.
PRODUCTS
Our NIKE Brand product offerings are aligned around our consumer construct focused on Men’s, Women’s and Kids’. We also design products specifically for the Jordan Brand and Converse. We believe this approach allows us to create products that better meet individual consumer needs while accelerating our largest growth opportunities.
NIKE’s athletic footwear products are designed primarily for specific athletic use, although a large percentage of the products are worn for casual or leisure purposes. We place considerable emphasis on innovation and high-quality construction in the development and manufacturing of our products. Our Men’s, Women’s and Jordan Brand footwear products currently lead in footwear sales and we expect them to continue to do so.
We also sell sports apparel, which features the same trademarks and are sold predominantly through the same marketing and distribution channels as athletic footwear. Our sports apparel, similar to our athletic footwear products, is designed primarily for athletic use, although many of the products are worn for casual or leisure purposes, and demonstrates our commitment to innovation and high-quality construction. Our Men’s and Women’s apparel products currently lead in apparel sales and we expect them to continue to do so. We often market footwear, apparel and accessories in “collections” of similar use or by category. We also market apparel with licensed college and professional team and league logos.
We sell a line of performance equipment and accessories under the NIKE Brand name, including bags, socks, sport balls, eyewear, timepieces, digital devices, bats, gloves, protective equipment and other equipment designed for sports activities. We also sell small amounts of various plastic products to other manufacturers through our wholly-owned subsidiary, NIKE IHM, Inc., doing business as Air Manufacturing Innovation.
Our Jordan Brand designs, distributes and licenses athletic and casual footwear, apparel and accessories predominantly focused on basketball performance and culture using the Jumpman trademark. Sales and operating results for Jordan Brand products are reported within the respective NIKE Brand geographic operating segments.
Our wholly-owned subsidiary brand, Converse, headquartered in Boston, Massachusetts, designs, distributes and licenses casual sneakers, apparel and accessories under the Converse, Chuck Taylor, All Star, One Star, Star Chevron and Jack Purcell trademarks. Operating results of the Converse brand are reported on a stand-alone basis.
In addition to the products we sell to our wholesale customers and directly to consumers through our NIKE Direct operations, we have also entered into license agreements that permit unaffiliated parties to manufacture and sell, using NIKE-owned trademarks, certain apparel, digital devices and applications and other equipment designed for sports activities.
2023 FORM 10-K 1
Table of Contents
We also offer interactive consumer services and experiences as well as digital products through our digital platforms, including fitness and activity apps; sport, fitness and wellness content; and digital services and features in retail stores that enhance the consumer experience.
SALES AND MARKETING
We experience moderate fluctuations in aggregate sales volume during the year. Historically, revenues in the first and fourth fiscal quarters have slightly exceeded those in the second and third fiscal quarters. However, the mix of product sales may vary considerably as a result of changes in seasonal and geographic demand for particular types of footwear, apparel and equipment, as well as other macroeconomic, strategic, operating and logistics-related factors.
Because NIKE is a consumer products company, the relative popularity and availability of various sports and fitness activities, as well as changing design trends, affect the demand for our products. We must, therefore, respond to trends and shifts in consumer preferences by adjusting the mix of existing product offerings, developing new products, styles and categories and influencing sports and fitness preferences through extensive marketing. Failure to respond in a timely and adequate manner could have a material adverse effect on our sales and profitability. This is a continuing risk. Refer to Item 1A. Risk Factors.
OUR MARKETS
We report our NIKE Brand operations based on our internal geographic organization. Each NIKE Brand geographic segment operates predominantly in one industry: the design, development, marketing and selling of athletic footwear, apparel and equipment. The Company’s reportable operating segments for the NIKE Brand are: North America; Europe, Middle East & Africa (“EMEA”); Greater China; and Asia Pacific & Latin America (“APLA”), and include results for the NIKE and Jordan brands. Sales through our NIKE Direct operations are managed within each geographic operating segment.
Converse is also a reportable operating segment and operates predominately in one industry: the design, marketing, licensing and selling of casual sneakers, apparel and accessories. Converse direct to consumer operations, including digital commerce, are reported within the Converse operating segment results.
UNITED STATES MARKET
For fiscal 2023, NIKE Brand and Converse sales in the United States accounted for approximately 43% of total revenues, compared to 40% and 39% for fiscal 2022 and fiscal 2021, respectively. We sell our products to thousands of retail accounts in the United States, including a mix of footwear stores, sporting goods stores, athletic specialty stores, department stores, skate, tennis and golf shops and other retail accounts. In the United States, we utilize NIKE sales offices to solicit such sales. During fiscal 2023, our three largest United States customers accounted for approximately 22% of sales in the United States.
Our NIKE Direct and Converse direct to consumer operations sell our products to consumers through various digital platforms. In addition, our NIKE Direct and Converse direct to consumer operations sell products through the following number of retail stores in the United States:
| U.S. RETAIL STORES | NUMBER | ||||
| NIKE Brand factory stores | 213 | ||||
| NIKE Brand in-line stores (including employee-only stores) | 74 | ||||
| Converse stores (including factory stores) | 82 | ||||
| TOTAL | 369 | ||||
In the United States, NIKE has eight significant distribution centers. Refer to Item 2. Properties for further information.
2023 FORM 10-K 2
Table of Contents
INTERNATIONAL MARKETS
For fiscal 2023, non-U.S. NIKE Brand and Converse sales accounted for approximately 57% of total revenues, compared to 60% and 61% for fiscal 2022 and fiscal 2021, respectively. We sell our products to retail accounts through our own NIKE Direct operations and through a mix of independent distributors, licensees and sales representatives around the world. We sell to thousands of retail accounts and ship products from 67 distribution centers outside of the United States. Refer to Item 2. Properties for further information on distribution facilities outside of the United States. During fiscal 2023, NIKE’s three largest customers outside of the United States accounted for approximately 14% of total non-U.S. sales.
In addition to NIKE-owned and Converse-owned digital commerce platforms in over 40 countries, our NIKE Direct and Converse direct to consumer businesses operate the following number of retail stores outside the United States:
| NON-U.S. RETAIL STORES | NUMBER | ||||
| NIKE Brand factory stores | 560 | ||||
| NIKE Brand in-line stores (including employee-only stores) | 49 | ||||
| Converse stores (including factory stores) | 54 | ||||
| TOTAL | 663 | ||||
SIGNIFICANT CUSTOMER
No customer accounted for 10% or more of our consolidated net Revenues during fiscal 2023.
PRODUCT RESEARCH, DESIGN AND DEVELOPMENT
We believe our research, design and development efforts are key factors in our success. Technical innovation in the design and manufacturing process of footwear, apparel and athletic equipment receives continued emphasis as we strive to produce products that help to enhance athletic performance, reduce injury and maximize comfort, while decreasing our environmental impact.
In addition to our own staff of specialists in the areas of biomechanics, chemistry, exercise physiology, engineering, digital technologies, industrial design, sustainability and related fields, we also utilize research committees and advisory boards made up of athletes, coaches, trainers, equipment managers, orthopedists, podiatrists, physicians and other experts who consult with us and review certain designs, materials and concepts for product and manufacturing, design and other process improvements and compliance with product safety regulations around the world. Employee athletes, athletes engaged under sports marketing contracts and other athletes wear-test and evaluate products during the design and development process.
As we continue to develop new technologies, we are simultaneously focused on the design of innovative products and experiences incorporating such technologies throughout our product categories and consumer applications. Using market intelligence and research, our various design teams identify opportunities to leverage new technologies in existing categories to respond to consumer preferences. The proliferation of Nike Air, Zoom, Free, Dri-FIT, Flyknit, FlyEase, ZoomX, Air Max, React and Forward technologies, among others, typifies our dedication to designing innovative products.
MANUFACTURING
Nearly all of our footwear and apparel products are manufactured outside the United States by independent manufacturers (“contract manufacturers”), many of which operate multiple factories. We are also supplied, primarily indirectly, by a number of materials, or “Tier 2” suppliers, who provide the principal materials used in footwear and apparel finished goods products. As of May 31, 2023, we had 146 strategic Tier 2 suppliers.
As of May 31, 2023, our contract manufacturers operated 123 finished goods footwear factories located in 11 countries. For fiscal 2023, NIKE Brand footwear finished goods were manufactured by 15 contract manufacturers, many of which operate multiple factories. The largest single finished goods footwear factory accounted for approximately 9% of total fiscal 2023 NIKE Brand footwear production. For fiscal 2023, factories in Vietnam, Indonesia and China manufactured approximately 50%, 27% and 18% of total NIKE Brand footwear, respectively. For fiscal 2023, four footwear contract manufacturers each accounted for greater than 10% of footwear production and in the aggregate accounted for approximately 58% of NIKE Brand footwear production.
As of May 31, 2023, our contract manufacturers operated 291 finished goods apparel factories located in 31 countries. For fiscal 2023, NIKE Brand apparel finished goods were manufactured by 55 contract manufacturers, many of which operate multiple factories. The largest single finished goods apparel factory accounted for approximately 8% of total fiscal 2023 NIKE Brand apparel production. For fiscal 2023, factories in Vietnam, China and Cambodia manufactured approximately 29%, 18% and 16%
2023 FORM 10-K 3
Table of Contents
of total NIKE Brand apparel, respectively. For fiscal 2023, one apparel contract manufacturer accounted for more than 10% of apparel production, and the top five contract manufacturers in the aggregate accounted for approximately 52% of NIKE Brand apparel production.
NIKE’s contract manufacturers buy raw materials for the manufacturing of our footwear, apparel and equipment products. Most raw materials are available and purchased by those contract manufacturers in the countries where manufacturing takes place.
The principal materials used in our footwear products are natural and synthetic rubber, plastic compounds, foam cushioning materials, natural and synthetic leather, nylon, polyester and natural fiber textiles, as well as polyurethane films used to make NIKE Air-Sole cushioning components. During fiscal 2023, Air Manufacturing Innovation, a wholly-owned subsidiary, with facilities near Beaverton, Oregon, in Dong Nai Province, Vietnam, and St. Charles, Missouri, as well as contract manufacturers in China and Vietnam, were our suppliers of NIKE Air-Sole cushioning components used in footwear.
The principal materials used in our apparel products are natural and synthetic fabrics, yarns and threads (both virgin and recycled); specialized performance fabrics designed to efficiently wick moisture away from the body, retain heat and repel rain and/or snow; and plastic and metal hardware.
In fiscal 2023, we experienced ongoing supply chain volatility during the first part of the year, which improved gradually during the course of the year. We also experienced higher supply chain network costs primarily due to inflationary pressures during the year. Despite competition for certain materials during fiscal 2023, contract manufacturers were able to source sufficient quantities of raw materials for use in our footwear and apparel products. Refer to Item 1A. Risk Factors, for additional discussion of the impact of sourcing risks on our business.
Since 1972, Sojitz Corporation of America (“Sojitz America”), a large Japanese trading company and the sole owner of our redeemable preferred stock, has performed import-export financing services for us.
INTERNATIONAL OPERATIONS AND TRADE
Our international operations and sources of supply are subject to the usual risks of doing business abroad, such as the implementation of, or potential changes in, foreign and domestic trade policies, increases in import duties, anti-dumping measures, quotas, safeguard measures, trade restrictions, restrictions on the transfer of funds and, in certain parts of the world, political tensions, instability, conflicts, nationalism and terrorism, and resulting sanctions and other measures imposed in response to such issues. We have not, to date, been materially affected by any such risk but cannot predict the likelihood of such material effects occurring in the future.
In recent years, uncertain global and regional economic and political conditions have affected international trade and increased protectionist actions around the world. These trends are affecting many global manufacturing and service sectors, and the footwear and apparel industries, as a whole, are not immune. Companies in our industry are facing trade protectionism in many different regions, and, in nearly all cases, we are working together with industry groups to address trade issues and reduce the impact to the industry, while observing applicable competition laws. Notwithstanding our efforts, protectionist measures have resulted in increases in the cost of our products, and additional measures, if implemented, could adversely affect sales and/or profitability for NIKE, as well as the imported footwear and apparel industry as a whole.
We monitor protectionist trends and developments throughout the world that may materially impact our industry, and we engage in administrative and judicial processes to mitigate trade restrictions. We are actively monitoring actions that may result in additional anti-dumping measures and could affect our industry. We are also monitoring for and advocating against other impediments that may limit or delay customs clearance for imports of footwear, apparel and equipment. NIKE also advocates for trade liberalization for footwear and apparel in a number of bilateral and multilateral free trade agreements. Changes in, and responses to, U.S. trade policies, including the imposition of tariffs or penalties on imported goods or retaliatory measures by other countries, have negatively affected, and could in the future negatively affect, U.S. corporations, including NIKE, with business operations and/or consumer markets in those countries, which could also make it necessary for us to change the way we conduct business, either of which may have an adverse effect on our business, financial condition or our results of operations. In addition, with respect to proposed trade restrictions, we work with a broad coalition of global businesses and trade associations representing a wide variety of sectors to help ensure that any legislation enacted and implemented (i) addresses legitimate and core concerns, (ii) is consistent with international trade rules and (iii) reflects and considers domestic economies and the important role they may play in the global economic community.
Where trade protection measures are implemented, we believe we have the ability to develop, over a period of time, adequate alternative sources of supply for the products obtained from our present suppliers. If events prevented us from acquiring products from our suppliers in a particular country, our operations could be temporarily disrupted and we could experience an adverse financial impact. However, we believe we could abate any such disruption, and that much of the adverse impact on supply would, therefore, be of a short-term nature, although alternate sources of supply might not be as cost-effective and could have an ongoing adverse impact on profitability.
2023 FORM 10-K 4
Table of Contents
Our international operations are also subject to compliance with the U.S. Foreign Corrupt Practices Act (the “FCPA”), and other anti-bribery laws applicable to our operations. We source a significant portion of our products from, and have important consumer markets, outside of the United States. We have an ethics and compliance program to address compliance with the FCPA and similar laws by us, our employees, agents, suppliers and other partners. Refer to Item 1A. Risk Factors for additional information on risks relating to our international operations.
COMPETITION
The athletic footwear, apparel and equipment industry is highly competitive on a worldwide basis. We compete internationally with a significant number of athletic and leisure footwear companies, athletic and leisure apparel companies, sports equipment companies and large companies having diversified lines of athletic and leisure footwear, apparel and equipment, including adidas, Anta, ASICS, Li Ning, lululemon athletica, New Balance, Puma, Under Armour and V.F. Corporation, among others. The intense competition and the rapid changes in technology and consumer preferences in the markets for athletic and leisure footwear and apparel and athletic equipment constitute significant risk factors in our operations. Refer to Item 1A. Risk Factors for additional information.
NIKE is the largest seller of athletic footwear and apparel in the world. Important aspects of competition in this industry are:
•Product attributes such as quality; performance and reliability; new product style, design, innovation and development; as well as consumer price/value.
•Consumer connection, engagement and affinity for brands and products, developed through marketing, promotion and digital experiences; social media interaction; customer support and service; identification with prominent and influential athletes, influencers, public figures, coaches, teams, colleges and sports leagues who endorse our brands and use our products and active engagement through sponsored sporting events and clinics.
•Effective sourcing and distribution of products, with attractive merchandising and presentation at retail, both in-store and on digital platforms.
We believe that we are competitive in all of these areas.
TRADEMARKS AND PATENTS
We believe that our intellectual property rights are important to our brand, our success and our competitive position. We strategically pursue available protections of these rights and vigorously protect them against third-party theft and infringement.
We use trademarks on nearly all of our products and packaging, and in our marketing materials, and believe having distinctive marks that are readily identifiable is an important factor in creating a market for our goods, in identifying our brands and the Company, and in distinguishing our goods from the goods of others. We consider our NIKE and Swoosh Design trademarks to be among our most valuable assets and we have registered these trademarks in over 190 jurisdictions worldwide. In addition, we own many other trademarks that we use in marketing our products. We own common law rights in the trade dress of several distinctive shoe designs and elements. For certain trade dress, we have sought and obtained trademark registrations.
We have copyright protection in our designs, graphics, software applications, digital goods and other original works. When appropriate, we also obtain registered copyrights.
We file for, own and maintain many U.S. and foreign utility and design patents protecting components, technologies, materials, manufacturing techniques, features, functionality, and industrial designs used in and for the manufacture of various athletic, performance, and leisure footwear and apparel, including physical and digital versions thereof, athletic equipment, and digital devices, and related software applications. These patents expire at various times.
We believe our success depends upon our capabilities in areas such as design, research and development, production and marketing and is supported and protected by our intellectual property rights, such as trademarks, utility and design patents, copyrights, and trade secrets, among others.
We have followed a policy of applying for and registering intellectual property rights in the United States and select foreign countries on trademarks, inventions, innovations and designs that we deem valuable. We also continue to vigorously protect our intellectual property, including trademarks, patents and trade secrets against third-party infringement and misappropriation.
2023 FORM 10-K 5
Table of Contents
HUMAN CAPITAL RESOURCES
At NIKE, we consider the strength and effective management of our workforce to be essential to the ongoing success of our business. We believe that it is important to attract, develop and retain a diverse and engaged workforce at all levels of our business and that such a workforce fosters creativity and accelerates innovation. We are focused on building an increasingly diverse talent pipeline that reflects our consumers, athletes and the communities we serve.
CULTURE
Each employee shapes NIKE’s culture through behaviors and practices. This starts with our Maxims, which represent our core values and, along with our Code of Conduct, feature the fundamental behaviors that help anchor, inform and guide us and apply to all employees. Our mission is to bring inspiration and innovation to every athlete in the world, which includes the belief that if you have a body, you are an athlete. We aim to do this by creating groundbreaking sport innovations, making our products more sustainably, building a creative and diverse global team, supporting the well-being of our employees and making a positive impact in communities where we live and work. Our mission is aligned with our deep commitment to maintaining an environment where all NIKE employees have the opportunity to reach their full potential, to connect to our brands and to shape our workplace culture. We believe providing for growth and retention of our employees is essential in fostering such a culture and are dedicated to giving access to training programs and career development opportunities, including trainings on NIKE’s values, history and business, trainings on developing leadership skills at all levels, tools and resources for managers and qualified tuition reimbursement opportunities.
As part of our commitment to empowering our employees to help shape our culture, we source employee feedback through our Engagement Survey program, including several corporate pulse surveys. The program provides every employee throughout the globe an opportunity to provide confidential feedback on key areas known to drive employee engagement, including their satisfaction with their managers, their work and the Company generally. The program also measures our employees’ emotional commitment to NIKE as well as NIKE’s culture of diversity, equity and inclusion. NIKE also provides multiple points of contact for employees to speak up if they experience something that does not align with our values or otherwise violates our workplace policies, even if they are uncertain what they observed or heard is a violation of company policy.
As part of our commitment to make a positive impact on our communities, we maintain a goal of investing 2% of our prior fiscal year’s pre-tax income into global communities. The focus of this investment continues to be inspiring kids to be active through play and sport as well as uniting and inspiring communities to create a better and more equitable future for all. Our community investments are an important part of our culture in that we also support employees in giving back to community organizations through donations and volunteering, which are matched by the NIKE Foundation where eligible.
EMPLOYEE BASE
As of May 31, 2023, we had approximately 83,700 employees worldwide, including retail and part-time employees. We also utilize independent contractors and temporary personnel to supplement our workforce.
None of our employees are represented by a union, except certain employees in the EMEA and APLA geographies are members of and/or represented by trade unions, as allowed or required by local law and/or collective bargaining agreements. Also, in some countries outside of the United States, local laws require employee representation by works councils (which may be entitled to information and consultation on certain subsidiary decisions) or by organizations similar to a union. In certain European countries, we are required by local law to enter into, and/or comply with, industry-wide or national collective bargaining agreements. NIKE has never experienced a material interruption of operations due to labor disagreements.
DIVERSITY, EQUITY AND INCLUSION
Diversity, equity and inclusion (“DE&I”) is a strategic priority for NIKE and we are committed to having an increasingly diverse team and culture. We aim to foster an inclusive and accessible workplace through recruitment, development and retention of diverse talent with the goal of expanding representation across all dimensions of diversity over the long term. We remain committed to the targets announced in fiscal 2021 for the Company to work toward by fiscal 2025, including increasing representation of women in our global corporate workforce and leadership positions, as well as increasing representation of U.S. racial and ethnic minorities in our U.S. corporate workforce and at the Director level and above.
We continue to enhance our efforts to recruit diverse talent through our traditional channels and through initiatives, such as partnerships with athletes and sports-related organizations to create apprenticeship programs and new partnerships with organizations, colleges and universities that serve diverse populations. Additionally, we are prioritizing DE&I education so that all NIKE employees and leaders have the cultural awareness and understanding to lead inclusively and build diverse and inclusive teams. We also have Employee Networks, collectively known as NikeUNITED, representing various employee groups.
2023 FORM 10-K 6
Table of Contents
Our DE&I focus extends beyond our workforce and includes our communities, which we support in a number of ways. We have committed to investments that aim to address racial inequality and improve diversity and representation in our communities. We also are leveraging our global scale to accelerate business diversity, including investing in business training programs for women and increasing the proportion of services supplied by minority-owned businesses.
COMPENSATION AND BENEFITS
NIKE’s total rewards are intended to be competitive and equitable, meet the diverse needs of our global teammates and reinforce our values. We are committed to providing comprehensive, competitive and equitable pay and benefits to our employees, and we have invested, and aim to continue to invest, in our employees through growth and development and holistic well-being initiatives. Our initiatives in this area include:
•We are committed to competitive pay and to reviewing our pay and promotion practices annually.
•We have an annual company bonus plan and a retail-focused bonus plan applicable to all eligible employees. Both programs are focused on rewarding employees for company performance, which we believe reinforces our culture and rewards behaviors that support collaboration and teamwork.
•We provide comprehensive family care benefits in the U.S. and globally where practicable, including family planning coverage, backup care and child/elder care assistance as well as an income-based childcare subsidy for eligible employees.
•Our Military Leave benefit provides up to 12 weeks of paid time off every 12 months.
•We offer free access to our Sport Centers at our world headquarters for our full-time employees and North America store employees.
•We provide employees free access to mindfulness and meditation resources, as well as live classes through our Sport Centers.
•We provide all employees and their families globally with free and confidential visits with a mental health counselor through a third-party provider and our global Employee Assistance Program (EAP).
•We provide support to our employees in a variety of ways during times of crisis, including pay continuity under certain circumstances, our natural disaster assistance program, and ongoing support for challenges related to the COVID-19 pandemic.
•We provide a hybrid work approach for the majority of employees, as well as a Four Week Flex, which provides employees an opportunity to work from a location of their choice for up to four weeks per year.
•We offer a Well-Being Week where we close our corporate offices for a full-week in the summer and Well-Being Days for our teammates in our retail stores and distribution centers, and encourage our teammates to focus on their well-being.
•We provide inclusive family planning benefits and transgender healthcare coverage for eligible employees covered on the U.S. Health Plan, including access to both restorative services and personal care.
•We provide all U.S. employees with unlimited free financial coaching through a third-party provider.
Additional information related to our human capital strategy can be found in our FY22 NIKE, Inc. Impact Report, which is available on the Impact section of about.nike.com. Information contained on or accessible through our websites is not incorporated into, and does not form a part of, this Annual Report or any other report or document we file with the SEC, and any references to our websites are intended to be inactive textual references only.
AVAILABLE INFORMATION AND WEBSITES
Our NIKE digital commerce website is located at www.nike.com. On our NIKE corporate website, located at investors.nike.com, we post the following filings as soon as reasonably practicable after they are electronically filed with, or furnished to, the United States Securities and Exchange Commission (the “SEC”): our annual report on Form 10-K, our quarterly reports on Form 10-Q, our current reports on Form 8-K and any amendments to those reports filed or furnished pursuant to Section 13(a) or 15(d) of the Securities and Exchange Act of 1934, as amended. Our proxy statements are also posted on our corporate website. All such filings on our corporate website are available free of charge. Copies of these filings are also available on the SEC’s website at www.sec.gov. Also available on our corporate website are the charters of the committees of our Board of Directors, as well as our corporate governance guidelines and code of ethics. Copies of any of these documents will be provided in print to any shareholder who submits a request in writing to NIKE Investor Relations, One Bowerman Drive, Beaverton, Oregon 97005-6453. Information contained on or accessible through our website is not incorporated into, and does not form a part of, this Annual Report or any other report or document we file with the SEC, and any references to our website are intended to be inactive textual references only.
2023 FORM 10-K 7
Table of Contents
INFORMATION ABOUT OUR EXECUTIVE OFFICERS
The executive officers of NIKE, Inc. as of July 20, 2023, are as follows:
 | Mark G. Parker, Executive Chairman — Mr. Parker, 67, is Executive Chairman of the Board of Directors and served as President and Chief Executive Officer from 2006 – January 2020. He has been employed by NIKE since 1979 with primary responsibilities in product research, design and development, marketing and brand management. Mr. Parker was appointed divisional Vice President in charge of product development in 1987, corporate Vice President in 1989, General Manager in 1993, Vice President of Global Footwear in 1998 and President of the NIKE Brand in 2001. | ||||||||||
 | John J. Donahoe II, President and Chief Executive Officer — Mr. Donahoe, 63, was appointed President and Chief Executive Officer in January 2020 and has been a director since 2014. He brings expertise in digital commerce, technology and global strategy. He previously served as President and Chief Executive Officer at ServiceNow, Inc. Prior to joining ServiceNow, Inc., he served as President and Chief Executive Officer of eBay, Inc. He also held leadership roles at Bain & Company for two decades. | ||||||||||
 | Matthew Friend, Executive Vice President and Chief Financial Officer — Mr. Friend, 45, joined NIKE in 2009 and leads the Company’s finance, demand & supply management, procurement and global places & services organizations. He joined NIKE as Senior Director of Corporate Strategy and Development, and was appointed Chief Financial Officer of Emerging Markets in 2011. In 2014, Mr. Friend was appointed Chief Financial Officer of Global Categories, Product and Functions, and was subsequently appointed Chief Financial Officer of the NIKE Brand in 2016. He was also appointed Vice President of Investor Relations in 2019. Mr. Friend was appointed as Executive Vice President and Chief Financial Officer of NIKE, Inc. in April 2020. Prior to joining NIKE, he worked in the financial industry including roles as VP of investment banking and mergers and acquisitions at Goldman Sachs and Morgan Stanley. | ||||||||||
 | Monique S. Matheson, Executive Vice President, Chief Human Resources Officer — Ms. Matheson, 56, joined NIKE in 1998, with primary responsibilities in the human resources function. She was appointed as Vice President and Senior Business Partner in 2011 and Vice President, Chief Talent and Diversity Officer in 2012. Ms. Matheson was appointed Executive Vice President, Global Human Resources in 2017. | ||||||||||
 | Ann M. Miller, Executive Vice President, Chief Legal Officer — Ms. Miller, 49, joined NIKE in 2007 and serves as EVP, Chief Legal Officer for NIKE, Inc. In her capacity as Chief Legal Officer, she oversees all legal, compliance, government & public affairs, social community impact, security, resilience and investigation matters of the Company. For the past six years, she served as Vice President, Corporate Secretary and Chief Ethics & Compliance Officer. She previously served as Converse’s General Counsel, and brings more than 20 years of legal and business expertise to her role. Prior to joining NIKE, Ms. Miller worked at the law firm Sullivan & Cromwell. | ||||||||||
 | Heidi O’Neill, President, Consumer, Brand & Product — Ms. O’Neill, 58, joined NIKE in 1998 and leads the integration of global Men’s, Women’s & Kids’ consumer teams, the entire global product engine and global brand marketing and sports marketing to build deep storytelling, relationships and engagement with the brand. Since joining NIKE, she has held a variety of key roles, including leading NIKE’s marketplace and four geographic operating regions, leading NIKE Direct and accelerating NIKE’s retail and digital-commerce business and creating and leading NIKE’s Women’s business. Prior to NIKE, Ms. O’Neill held roles at Levi Strauss & Company and Foote, Cone & Belding. | ||||||||||
 | Craig Williams, President, Geographies & Marketplace — Mr. Williams, 54, joined NIKE in 2019 and leads NIKE’s four geographies and marketplace across the NIKE Direct and wholesale business. In addition, he leads the Supply Chain and Logistics organization. Mr. Williams joined NIKE as President of Jordan Brand overseeing a team of designers, product developers, marketers and business leaders. Prior to NIKE, he was Senior Vice President, The Coca-Cola Co., and President of The McDonald’s Division (TMD) Worldwide. Mr. Williams has also held roles at CIBA Vision and Kraft Foods Inc., and served five years in the U.S. Navy as a Naval Nuclear Power Officer. | ||||||||||
2023 FORM 10-K 8
Table of Contents
ITEM 1A. RISK FACTORS
Special Note Regarding Forward-Looking Statements and Analyst Reports
Certain written and oral statements, other than purely historic information, including estimates, projections, statements relating to NIKE’s business plans, objectives and expected operating or financial results and the assumptions upon which those statements are based, made or incorporated by reference from time to time by NIKE or its representatives in this Annual Report, other reports, filings with the SEC, press releases, conferences or otherwise, are “forward-looking statements” within the meaning of the Private Securities Litigation Reform Act of 1995 and Section 21E of the Securities Exchange Act of 1934, as amended. Forward-looking statements include, without limitation, any statement that may predict, forecast, indicate or imply future results, performance or achievements, and may contain the words “believe,” “anticipate,” “expect,” “estimate,” “project,” “will be,” “will continue,” “will likely result” or words or phrases of similar meaning. Forward-looking statements involve risks and uncertainties which may cause actual results to differ materially from the forward-looking statements. The risks and uncertainties are detailed from time to time in reports filed by NIKE with the SEC, including reports filed on Forms 8-K, 10-Q and 10-K, and include, among others, the following: international, national and local political, civil, economic and market conditions, including high, and increases in, inflation and interest rates; the size and growth of the overall athletic or leisure footwear, apparel and equipment markets; intense competition among designers, marketers, distributors and sellers of athletic or leisure footwear, apparel and equipment for consumers and endorsers; demographic changes; changes in consumer preferences; popularity of particular designs, categories of products and sports; seasonal and geographic demand for NIKE products; difficulties in anticipating or forecasting changes in consumer preferences, consumer demand for NIKE products and the various market factors described above; our ability to execute on our sustainability strategy and achieve our sustainability-related goals and targets, including sustainable product offerings; difficulties in implementing, operating and maintaining NIKE’s increasingly complex information technology systems and controls, including, without limitation, the systems related to demand and supply planning and inventory control; interruptions in data and information technology systems; consumer data security; fluctuations and difficulty in forecasting operating results, including, without limitation, the fact that advance orders may not be indicative of future revenues due to changes in shipment timing, the changing mix of orders with shorter lead times, and discounts, order cancellations and returns; the ability of NIKE to sustain, manage or forecast its growth and inventories; the size, timing and mix of purchases of NIKE’s products; increases in the cost of materials, labor and energy used to manufacture products; new product development and introduction; the ability to secure and protect trademarks, patents and other intellectual property; product performance and quality; customer service; adverse publicity and an inability to maintain NIKE’s reputation and brand image, including without limitation, through social media or in connection with brand damaging events; the loss of significant customers or suppliers; dependence on distributors and licensees; business disruptions; increased costs of freight and transportation to meet delivery deadlines; increases in borrowing costs due to any decline in NIKE’s debt ratings; changes in business strategy or development plans; general risks associated with doing business outside of the United States, including, without limitation, exchange rate fluctuations, import duties, tariffs, quotas, sanctions, political and economic instability, conflicts and terrorism; the potential impact of new and existing laws, regulations or policy, including, without limitation, tariffs, import/export, trade, wage and hour or labor and immigration regulations or policies; changes in government regulations; the impact of, including business and legal developments relating to, climate change, extreme weather conditions and natural disasters; litigation, regulatory proceedings, sanctions or any other claims asserted against NIKE; the ability to attract and retain qualified employees, and any negative public perception with respect to key personnel or our corporate culture, values or purpose; the effects of NIKE’s decision to invest in or divest of businesses or capabilities; health epidemics, pandemics and similar outbreaks, including the COVID-19 pandemic; and other factors referenced or incorporated by reference in this Annual Report and other reports.
Investors should also be aware that while NIKE does, from time to time, communicate with securities analysts, it is against NIKE’s policy to disclose to them any material non-public information or other confidential commercial information. Accordingly, shareholders should not assume that NIKE agrees with any statement or report issued by any analyst irrespective of the content of the statement or report. Furthermore, NIKE has a policy against confirming financial forecasts or projections issued by others. Thus, to the extent that reports issued by securities analysts contain any projections, forecasts or opinions, such reports are not the responsibility of NIKE.
Risk Factors
The risks included here are not exhaustive. Other sections of this Annual Report may include additional factors which could adversely affect NIKE’s business and financial performance. Moreover, NIKE operates in a very competitive and rapidly changing environment. New risks emerge from time to time and it is not possible for management to predict all such risks, nor can it assess the impact of all such risks on NIKE’s business or the extent to which any risk, or combination of risks, may cause actual results to differ materially from those contained in any forward-looking statements. Given these risks and uncertainties, investors should not place undue reliance on forward-looking statements as a prediction of actual results.
2023 FORM 10-K 9
Table of Contents
Economic and Industry Risks
Global economic conditions could have a material adverse effect on our business, operating results and financial condition.
The uncertain state of the global economy, including high and rising levels of inflation and interest rates and the risk of a recession, continues to impact businesses around the world. If global economic and financial market conditions deteriorate, the following factors, among others, could have a material adverse effect on our business, operating results and financial condition:
•Our sales are impacted by discretionary spending by consumers. Declines in consumer spending have in the past resulted in and may in the future result in reduced demand for our products, increased inventories, reduced orders from retailers for our products, order cancellations, lower revenues, higher discounts and lower gross margins.
•In the future, we may be unable to access financing in the credit and capital markets at reasonable rates in the event we find it desirable to do so.
•We conduct transactions in various currencies, which creates exposure to fluctuations in foreign currency exchange rates relative to the U.S. Dollar. Continued volatility in the markets and exchange rates for foreign currencies and contracts in foreign currencies has had and could continue to have a significant impact on our reported operating results and financial condition.
•Continued volatility in the availability and prices for commodities and raw materials we use in our products and in our supply chain (such as cotton or petroleum derivatives) has had and could in the future have a material adverse effect on our costs, gross margins and profitability. In addition, supply chain issues caused by factors including the COVID-19 pandemic and geopolitical conflicts have impacted and may continue to impact the availability, pricing and timing for obtaining commodities and raw materials.
•If retailers of our products experience declining revenues or experience difficulty obtaining financing in the capital and credit markets to purchase our products, this could result in reduced orders for our products, order cancellations, late retailer payments, extended payment terms, higher accounts receivable, reduced cash flows, greater expense associated with collection efforts and increased bad debt expense.
•In the past, certain retailers of our products have experienced severe financial difficulty, become insolvent and ceased business operations, and this could occur in the future, which could negatively impact the sale of our products to consumers.
•If contract manufacturers of our products or other participants in our supply chain experience difficulty obtaining financing in the capital and credit markets to purchase raw materials or to finance capital equipment and other general working capital needs, it may result in delays or non-delivery of shipments of our products.
Our products, services and experiences face intense competition.
NIKE is a consumer products company and the relative popularity of various sports and fitness activities and changing design trends affect the demand for our products, services and experiences. The athletic footwear, apparel and equipment industry is highly competitive both in the United States and worldwide. We compete internationally with a significant number of athletic and leisure footwear companies, athletic and leisure apparel companies, sports equipment companies, private labels and large companies that have diversified lines of athletic and leisure footwear, apparel and equipment. We also compete with other companies for the production capacity of contract manufacturers that produce our products. In addition, we and our contract manufacturers compete with other companies and industries for raw materials used in our products. Our NIKE Direct operations, both through our digital commerce operations and retail stores, also compete with multi-brand retailers, which sell our products through their digital platforms and physical stores, and with digital commerce platforms. In addition, we compete with respect to the digital services and experiences we are able to offer our consumers, including fitness and activity apps; sport, fitness and wellness content and services; and digital services and features in retail stores that enhance the consumer experience.
Product offerings, technologies, marketing expenditures (including expenditures for advertising and endorsements), pricing, costs of production, customer service, digital commerce platforms, digital services and experiences and social media presence are areas of intense competition. These, in addition to ongoing rapid changes in technology, a reduction in barriers to the creation of new footwear and apparel companies and consumer preferences in the markets for athletic and leisure footwear, apparel, and equipment, services and experiences, constitute significant risk factors in our operations. In addition, the competitive nature of retail, including shifts in the ways in which consumers shop, and the continued proliferation of digital commerce, constitutes a risk factor implicating our NIKE Direct and wholesale operations. If we do not adequately and timely anticipate and respond to our competitors, our costs may increase, demand for our products may decline, possibly significantly, or we may need to reduce wholesale or suggested retail prices for our products.
2023 FORM 10-K 10
Table of Contents
Economic factors beyond our control, and changes in the global economic environment, including fluctuations in inflation and currency exchange rates, could result in lower revenues, higher costs and decreased margins and earnings.
A majority of our products are manufactured and sold outside of the United States, and we conduct purchase and sale transactions in various currencies, which creates exposure to the volatility of global economic conditions, including fluctuations in inflation and foreign currency exchange rates. Central banks may deploy various strategies to combat inflation, including increasing interest rates, which may impact our borrowing costs. Additionally, there has been, and may continue to be, volatility in currency exchange rates that impact the U.S. Dollar value relative to other international currencies. Our international revenues and expenses generally are derived from sales and operations in foreign currencies, and these revenues and expenses are affected by currency fluctuations, specifically amounts recorded in foreign currencies and translated into U.S. Dollars for consolidated financial reporting, as weakening of foreign currencies relative to the U.S. Dollar adversely affects the U.S. Dollar value of the Company’s foreign currency-denominated sales and earnings. Currency exchange rate fluctuations could also disrupt the business of the independent manufacturers that produce our products by making their purchases of raw materials more expensive and more difficult to finance. Foreign currency fluctuations have adversely affected and could continue to have an adverse effect on our results of operations and financial condition.
We hedge certain foreign currency exposures to lessen and delay, but not to completely eliminate, the effects of foreign currency fluctuations on our financial results. Since the hedging activities are designed to lessen volatility, they not only reduce the negative impact of a stronger U.S. Dollar or other trading currency, but they also reduce the positive impact of a weaker U.S. Dollar or other trading currency. Our future financial results have in the past been and could in the future be significantly affected by the value of the U.S. Dollar in relation to the foreign currencies in which we conduct business. The degree to which our financial results are affected for any given time period will depend in part upon our hedging activities.
We may be adversely affected by the financial health of our wholesale customers.
We extend credit to our customers based on an assessment of a customer’s financial condition, generally without requiring collateral. To assist in the scheduling of production and the shipping of our products, we offer certain customers the opportunity to place orders five to six months ahead of delivery under our futures ordering program. These advance orders may be canceled under certain conditions, and the risk of cancellation increases when dealing with financially unstable retailers or retailers struggling with economic uncertainty. In the past, some customers have experienced financial difficulties up to and including bankruptcies, which have had an adverse effect on our sales, our ability to collect on receivables and our financial condition. When the retail economy weakens or as consumer behavior shifts, retailers tend to be more cautious with orders. A slowing or changing economy in our key markets, including a recession, could adversely affect the financial health of our customers, which in turn could have an adverse effect on our results of operations and financial condition. In addition, product sales are dependent in part on high quality merchandising and an appealing retail environment to attract consumers, which requires continuing investments by retailers. Retailers that experience financial difficulties may fail to make such investments or delay them, resulting in lower sales and orders for our products.
Climate change and other sustainability-related matters, or legal, regulatory or market responses thereto, may have an adverse impact on our business and results of operations.
There are concerns that increased levels of carbon dioxide and other greenhouse gases in the atmosphere have caused, and may continue to cause, potentially at a growing rate, increases in global temperatures, changes in weather patterns and increasingly frequent and/or prolonged extreme weather and climate events. Climate change may also exacerbate challenges relating to the availability and quality of water and raw materials, including those used in the production of our products, and may result in changes in regulations or consumer preferences, which could in turn affect our business, operating results and financial condition. For example, there has been increased focus by governmental and non-governmental organizations, consumers, customers, employees and other stakeholders on products that are sustainably made and other sustainability matters, including responsible sourcing and deforestation, the use of plastic, energy and water, the recyclability or recoverability of packaging and materials transparency, any of which may require us to incur increased costs for additional transparency, due diligence and reporting. In addition, federal, state or local governmental authorities in various countries have proposed, and are likely to continue to propose, legislative and regulatory initiatives to reduce or mitigate the impacts of climate change on the environment. Various countries and regions are following different approaches to the regulation of climate change, which could increase the complexity of, and potential cost related to complying with, such regulations. Any of the foregoing may require us to make additional investments in facilities and equipment, may impact the availability and cost of key raw materials used in the production of our products or the demand for our products, and, in turn, may adversely impact our business, operating results and financial condition.
Although we have announced sustainability-related goals and targets, there can be no assurance that our stakeholders will agree with our strategies, and any perception, whether or not valid, that we have failed to achieve, or to act responsibly with respect to, such matters or to effectively respond to new or additional legal or regulatory requirements regarding climate change, could result in adverse publicity and adversely affect our business and reputation. Execution of these strategies and achievement of our goals is subject to risks and uncertainties, many of which are outside of our control. These risks and uncertainties include, but are not
2023 FORM 10-K 11
Table of Contents
limited to, our ability to execute our strategies and achieve our goals within the currently projected costs and the expected timeframes; the availability and cost of raw materials and renewable energy; unforeseen production, design, operational and technological difficulties; the outcome of research efforts and future technology developments, including the ability to scale projects and technologies on a commercially competitive basis such as carbon sequestration and/or other related processes; compliance with, and changes or additions to, global and regional regulations, taxes, charges, mandates or requirements relating to greenhouse gas emissions, carbon costs or climate-related goals; adapting products to customer preferences and customer acceptance of sustainable supply chain solutions; and the actions of competitors and competitive pressures. As a result, there is no assurance that we will be able to successfully execute our strategies and achieve our sustainability-related goals, which could damage our reputation and customer and other stakeholder relationships and have an adverse effect on our business, results of operations and financial condition.
Extreme weather conditions and natural disasters could negatively impact our operating results and financial condition.
Given the broad and global scope of our operations, we are particularly vulnerable to the physical risks of climate change, such as shifts in weather patterns. Extreme weather conditions in the areas in which our retail stores, suppliers, manufacturers, customers, distribution centers, offices, headquarters and vendors are located could adversely affect our operating results and financial condition. Moreover, natural disasters such as earthquakes, hurricanes, wildfires, tsunamis, floods or droughts, whether occurring in the United States or abroad, and their related consequences and effects, including energy shortages and public health issues, have in the past temporarily disrupted, and could in the future disrupt, our operations, the operations of our vendors, manufacturers and other suppliers or have in the past resulted in, and in the future could result in, economic instability that may negatively impact our operating results and financial condition. In particular, if a natural disaster or severe weather event were to occur in an area in which we or our suppliers, manufacturers, employees, customers, distribution centers or vendors are located, our continued success would depend, in part, on the safety and availability of the relevant personnel and facilities and proper functioning of our or third parties’ computer, network, telecommunication and other systems and operations. In addition, a natural disaster or severe weather event could negatively impact retail traffic to our stores or stores that carry our products and could have an adverse impact on consumer spending, any of which could in turn result in negative point-of-sale trends for our merchandise. Further, climate change may increase both the frequency and severity of extreme weather conditions and natural disasters, which may affect our business operations, either in a particular region or globally, as well as the activities of our third-party vendors and other suppliers, manufacturers and customers. We believe the diversity of locations in which we operate, our operational size, disaster recovery and business continuity planning and our information technology systems and networks, including the Internet and third-party services (“Information Technology Systems”), position us well, but may not be sufficient for all or for concurrent eventualities. If we were to experience a local or regional disaster or other business continuity event or concurrent events, we could experience operational challenges, in particular depending upon how a local or regional event may affect our human capital across our operations or with regard to particular aspects of our operations, such as key executive officers or personnel. For example, our world headquarters is located in an active seismic zone, which is at a higher risk for earthquakes and the related consequences or effects. Further, if we are unable to find alternative suppliers, replace capacity at key manufacturing or distribution locations or quickly repair damage to our Information Technology Systems or supply systems, we could be late in delivering, or be unable to deliver, products to our customers. These events could result in reputational damage, lost sales, cancellation charges or markdowns, all of which could have an adverse effect on our business, results of operations and financial condition.
Our financial condition and results of operations have been, and could in the future be, adversely affected by a pandemic, epidemic or other public health emergency.
Pandemics, including the COVID-19 pandemic, and other public health emergencies, and preventative measures taken to contain or mitigate such crises have caused, and may in the future cause, business slowdown or shutdown in affected areas and significant disruption in the financial markets, both globally and in the United States. These events have led to and could again lead to adverse impacts to our global supply chain, factory cancellation costs, store closures, and a decline in retail traffic and discretionary spending by consumers and, in turn, materially impact our business, sales, financial condition and results of operations as well as cause a volatile effective tax rate driven by changes in the mix of earnings across our jurisdictions. We cannot predict whether, and to what degree, our sales, operations and financial results could in the future be affected by the pandemic and preventative measures. Risks presented by pandemics and other public health emergencies include, but are not limited to:
•Deterioration in economic conditions in the United States and globally, including the effect of prolonged periods of inflation on our consumers and vendors;
•Disruption to our distribution centers, contract manufacturers, finished goods factories and other vendors, through the effects of facility closures, increased operating costs, reductions in operating hours, labor shortages, and real time changes in operating procedures, such as additional cleaning and disinfection procedures, which have had, and could in the future again have, a significant impact on our planned inventory production and distribution, including higher inventory levels or inventory shortages in various markets;
2023 FORM 10-K 12
Table of Contents
•Impacts to our distribution and logistics providers’ ability to operate, including labor and container shortages, and increases in their operating costs. These supply chain effects have had, and could in the future have, an adverse effect on our ability to meet consumer demand, including digital demand, and have in the past resulted in and could in the future result in extended inventory transit times and an increase in our costs of production and distribution, including increased freight and logistics costs and other expenses;
•Decreased retail traffic as a result of store closures, reduced operating hours, social distancing restrictions and/or changes in consumer behavior;
•Reduced consumer demand for our products, including as a result of a rise in unemployment rates, higher costs of borrowing, inflation and diminished consumer confidence;
•Cancellation or postponement of sports seasons and sporting events in multiple countries, and bans on large public gatherings, which have reduced and in the future could reduce consumer spending on our products and could impact the effectiveness of our arrangements with key endorsers;
•The risk that any safety protocols in NIKE-owned or affiliated facilities, including our offices, will not be effective or not be perceived as effective, or that any virus-related illnesses will be linked or alleged to be linked to such facilities, whether accurate or not;
•Incremental costs resulting from the adoption of preventative measures and compliance with regulatory requirements, including providing facial coverings and hand sanitizer, rearranging operations to follow social distancing protocols, conducting temperature checks, testing and undertaking regular and thorough disinfecting of surfaces;
•Bankruptcies or other financial difficulties facing our wholesale customers, which could cause them to be unable to make or delay making payments to us, or result in revised payment terms, cancellation or reduction of their orders; and
•Significant disruption of and volatility in global financial markets, which could have a negative impact on our ability to access capital in the future.
We cannot reasonably predict the ultimate impact of any pandemic or public health emergency, including the extent of any adverse impact on our business, results of operations and financial condition, which will depend on, among other things, the duration and spread of the pandemic or public health emergency, the impact of governmental regulations that have been, and may continue to be, imposed in response, the effectiveness of actions taken to contain or mitigate the outbreak, the availability, safety and efficacy of vaccines, including against emerging variants of the infectious disease, and global economic conditions. Additionally, disruptions have in the past made it more challenging to compare our performance, including our revenue growth and overall profitability, across quarters and fiscal years, and could have this effect in the future. Any pandemic or public health emergency may also affect our business, results of operations or financial condition in a manner that is not presently known to us or that we currently do not consider to present significant risks and may also exacerbate, or occur concurrently with, other risks discussed in this Item 1A. Risk Factors, any of which could have a material effect on us.
Business and Operational Risks
Failure to maintain our reputation, brand image and culture could negatively impact our business.
Our iconic brands have worldwide recognition, and our success depends on our ability to maintain and enhance our brand image and reputation. Maintaining, promoting and growing our brands will depend on our design and marketing efforts, including advertising and consumer campaigns, product innovation and product quality. Our commitment to product innovation, quality and sustainability, and our continuing investment in design (including materials), marketing and sustainability measures may not have the desired impact on our brand image and reputation. In addition, our success in maintaining, extending and expanding our brand image depends on our ability to adapt to a rapidly changing media and digital environment, including our reliance on social media and other digital advertising networks, and digital dissemination of advertising campaigns on our digital platforms and through our digital experiences and products. We could be adversely impacted if we fail to achieve any of these objectives.
Our brand value also depends on our ability to maintain a positive consumer perception of our corporate integrity, purpose and brand culture. Negative claims or publicity involving us, our culture and values, our products, services and experiences, consumer data, or any of our key employees, endorsers, sponsors, suppliers or partners could seriously damage our reputation and brand image, regardless of whether such claims are accurate. For example, while we require our suppliers of our products to operate their business in compliance with applicable laws and regulations, we do not control their practices. Negative publicity relating to a violation or an alleged violation of policies or laws by such suppliers could damage our brand image and diminish consumer trust in our brand. Further, our reputation and brand image could be damaged as a result of our support of, association with or lack of support or disapproval of certain social causes, as well as any decisions we make to continue to conduct, or change, certain of our activities in response to such considerations. Social media, which accelerates and potentially amplifies the scope of negative publicity, can increase the challenges of responding to negative claims. Adverse publicity about regulatory or legal action against us, or by us, could also damage our reputation and brand image, undermine consumer confidence in us and reduce long-term demand for our products, even if the regulatory or legal action is unfounded or not material to our operations. If
2023 FORM 10-K 13
Table of Contents
the reputation, culture or image of any of our brands is tarnished or if we receive negative publicity, then our sales, financial condition and results of operations could be materially and adversely affected.
Our business is affected by seasonality, which could result in fluctuations in our operating results.
We experience moderate fluctuations in aggregate sales volume during the year. Historically, revenues in the first and fourth fiscal quarters have slightly exceeded those in the second and third fiscal quarters. However, the mix of product sales may vary considerably from time to time or in the future as a result of strategic shifts in our business and seasonal or geographic demand for particular types of footwear, apparel and equipment and in connection with the timing of significant sporting events, such as the NBA Finals, Olympics or the World Cup, among others. In addition, our customers may cancel orders, change delivery schedules or change the mix of products ordered with minimal notice. As a result, we may not be able to accurately predict our quarterly sales. Accordingly, our results of operations are likely to fluctuate significantly from period to period. This seasonality, along with other factors that are beyond our control, including economic conditions, changes in consumer preferences, weather conditions, outbreaks of disease, social or political unrest, availability of import quotas, transportation disruptions and currency exchange rate fluctuations, has in the past adversely affected and could in the future adversely affect our business and cause our results of operations to fluctuate. Our operating margins are also sensitive to a number of additional factors that are beyond our control, including manufacturing and transportation costs, shifts in product sales mix and geographic sales trends, all of which we expect to continue. Results of operations in any period should not be considered indicative of the results to be expected for any future period.
If we are unable to anticipate consumer preferences and develop new products, we may not be able to maintain or increase our revenues and profits.
Our success depends on our ability to identify, originate and define product trends as well as to anticipate, gauge and react to changing consumer demands in a timely manner. However, lead times for many of our products may make it more difficult for us to respond rapidly to new or changing product trends or consumer preferences. All of our products are subject to changing consumer preferences that cannot be predicted with certainty. Our new products may not receive consumer acceptance as consumer preferences could shift rapidly to different types of performance products or away from these types of products altogether, and our future success depends in part on our ability to anticipate and respond to these changes. If we fail to anticipate accurately and respond to trends and shifts in consumer preferences by adjusting the mix of existing product offerings, developing new products, designs, styles and categories, and influencing sports and fitness preferences through extensive marketing, we could experience lower sales, excess inventories or lower profit margins, any of which could have an adverse effect on our results of operations and financial condition. In addition, we market our products globally through a diverse spectrum of advertising and promotional programs and campaigns, including social media and other digital advertising networks. If we do not successfully market our products or if advertising and promotional costs increase, these factors could have an adverse effect on our business, financial condition and results of operations.
We rely on technical innovation and high-quality products to compete in the market for our products.
Technical innovation and quality control in the design and manufacturing processes of footwear, apparel, equipment and other products and services are essential to the commercial success of our products and development of new products. Research and development play a key role in technical innovation. We rely upon specialists in the fields of biomechanics, chemistry, exercise physiology, engineering, digital technologies, industrial design, sustainability and related fields, as well as research committees and advisory boards made up of athletes, coaches, trainers, equipment managers, orthopedists, podiatrists and other experts to develop and test cutting-edge performance products. While we strive to produce products that help to enhance athletic performance and reduce injury and maximize comfort, if we fail to introduce technical innovation in our products, consumer demand for our products could decline, and if we experience problems with the quality of our products, we may incur substantial expense to remedy the problems and loss of consumer confidence.
Failure to continue to obtain or maintain high-quality endorsers of our products could harm our business.
We establish relationships with professional athletes, sports teams and leagues, as well as other public figures, including artists, designers and influencers, to develop, evaluate and promote our products, as well as establish product authenticity with consumers. However, as competition in our industry has increased, the costs associated with establishing and retaining such sponsorships and other relationships have increased, and competition to attract and retain high-quality endorsers has increased. If we are unable to maintain our current associations with professional athletes, sports teams and leagues, or other public figures, or to do so at a reasonable cost, we could lose the high visibility or on-field authenticity associated with our products, and we may be required to modify and substantially increase our marketing investments. As a result, our brands, net revenues, expenses and profitability could be harmed.
Furthermore, if certain endorsers were to stop using our products contrary to their endorsement agreements, our business could be adversely affected. In addition, actions taken or statements made by athletes, teams or leagues, or other endorsers, associated with our products or brand that harm the reputations of those athletes, teams or leagues, or endorsers, or our decisions to cease collaborating with certain endorsers in light of actions taken or statements made by them, have in the past harmed and could in the future seriously harm our brand image with consumers and, as a result, could have an adverse effect on
2023 FORM 10-K 14
Table of Contents
our sales and financial condition. Poor or non-performance by our endorsers, a failure to continue to correctly identify promising athletes, public figures or sports organizations, to use and endorse our products and brand or a failure to enter into cost-effective endorsement arrangements with prominent athletes, public figures and sports organizations could adversely affect our brand, sales and profitability.
Failure to accurately forecast consumer demand could lead to excess inventories or inventory shortages, which could result in decreased operating margins, reduced cash flows and harm to our business.
To meet anticipated demand for our products, we purchase products from manufacturers outside of our futures ordering program and in advance of customer orders, which we hold in inventory and resell to customers. There is a risk we may be unable to sell excess products ordered from manufacturers. Inventory levels in excess of customer demand may result in inventory write-downs, and the sale of excess inventory at discounted prices could significantly impair our brand image and have an adverse effect on our operating results, financial condition and cash flows. Conversely, if we underestimate consumer demand for our products or if our manufacturers fail to supply products we require at the time we need them, we may experience inventory shortages. Inventory shortages could delay shipments to customers, negatively impact retailer, distributor and consumer relationships and diminish brand loyalty. The difficulty in forecasting demand also makes it difficult to estimate our future results of operations, financial condition and cash flows from period to period. A failure to accurately predict the level of demand for our products could adversely affect our net revenues and net income, and we are unlikely to forecast such effects with any certainty in advance.
Our NIKE Direct operations have required and will continue to require a substantial investment and commitment of resources and are subject to numerous risks and uncertainties.
Our NIKE Direct operations, including our retail stores and digital platforms, have required and will continue to require significant investment. Our NIKE Direct stores have required and will continue to require substantial fixed investment in equipment and leasehold improvements and personnel. We have entered into substantial operating lease commitments for retail space. Certain stores have been designed and built to serve as high-profile venues to promote brand awareness and marketing activities and to integrate with our digital platforms. Because of their unique design and technological elements, locations and size, these stores require substantially more investment than other stores. Due to the high fixed-cost structure associated with our NIKE Direct retail stores, a decline in sales, a shift in consumer behavior away from brick-and-mortar retail, or the closure, temporary or otherwise, or poor performance of individual or multiple stores could result in significant lease termination costs, write-offs of equipment and leasehold improvements and employee-related costs.
Many factors unique to retail operations, some of which are beyond our control, pose risks and uncertainties. Risks include, but are not limited to: credit card fraud; mismanagement of existing retail channel partners; inability to manage costs associated with store construction and operation; and theft.
In addition, we have made significant investments in digital technologies and information systems for the digital aspect of our NIKE Direct operations, and our digital offerings will require continued investment in the development and upgrading of our technology platforms. In order to deliver high-quality digital experiences, our digital platforms must be designed effectively and work well with a range of other technologies, systems, networks, and standards that we do not control. We may not be successful in developing platforms that operate effectively with these technologies, systems, networks or standards. A growing portion of consumers access our NIKE Direct digital platforms, but in the event that it is more difficult for consumers to access and use our digital platforms, consumers find that our digital platforms do not effectively meet their needs or expectations or consumers choose not to access or use our digital platforms or use devices that do not offer access to our platforms, the success of our NIKE Direct operations could be adversely impacted. Our competitors may develop, or have already developed, digital experiences, features, content, services or technologies that are similar to ours or that achieve greater acceptance.
We may not realize a satisfactory return on our investment in our NIKE Direct operations and management’s attention from our other business opportunities could be diverted, which could have an adverse effect on our business, financial condition or results of operations.
If the technology-based systems that give our consumers the ability to shop or interact with us online do not function effectively, our operating results, as well as our ability to grow our digital commerce business globally or to retain our customer base, could be materially adversely affected.
Many of our consumers shop with us through our digital platforms. Increasingly, consumers are using mobile-based devices and applications to shop online with us and with our competitors, and to do comparison shopping, as well as to engage with us and our competitors through digital services and experiences that are offered on mobile platforms. We use social media and proprietary mobile applications to interact with our consumers and as a means to enhance their shopping experience. Any failure on our part to provide attractive, effective, reliable, secure and user-friendly digital commerce platforms that offer a wide assortment of merchandise with rapid delivery options and that continually meet the changing expectations of online shoppers or any failure to provide attractive digital experiences to our customers could place us at a competitive disadvantage, result in the loss of digital commerce and other sales, harm our reputation with consumers, have a material adverse impact on the growth of our digital commerce business globally and have a material adverse impact on our business and results of operations. In
2023 FORM 10-K 15
Table of Contents
addition, as use of our digital platforms continues to grow, we will need an increasing amount of technical infrastructure to continue to satisfy our consumers’ needs. If we fail to continue to effectively scale and adapt our digital platforms to accommodate increased consumer demand, our business may be subject to interruptions, delays or failures and consumer demand for our products and digital experiences could decline.
Risks specific to our digital commerce business also include diversion of sales from our and our retailers’ brick and mortar stores, difficulty in recreating the in-store experience through direct channels and liability for online content. Our failure to successfully respond to these risks might adversely affect sales in our digital commerce business, as well as damage our reputation and brands.
We rely significantly on information technology to operate our business, including our supply chain and retail operations, and any failure, inadequacy or interruption of that technology could harm our ability to effectively operate our business.
We are heavily dependent on Information Technology Systems, across our supply chain, including product design, production, forecasting, ordering, manufacturing, transportation, sales and distribution, as well as for processing financial information for external and internal reporting purposes, retail operations and other business activities. Information Technology Systems are critical to many of our operating activities and our business processes and may be negatively impacted by any service interruption or shutdown. For example, our ability to effectively manage and maintain our inventory and to ship products to customers on a timely basis depends significantly on the reliability of these Information Technology Systems. Over a number of years, we have implemented Information Technology Systems in all of the geographical regions in which we operate. Our work to integrate, secure and enhance these systems and related processes in our global operations is ongoing and NIKE will continue to invest in these efforts. We cannot provide assurance, however, that the measures we take to secure and enhance these systems will be sufficient to protect our Information Technology Systems and prevent cyber-attacks, system failures or data or information loss. The failure of these systems to operate effectively, including as a result of security breaches, viruses, hackers, malware, natural disasters, vendor business interruptions or other causes, failure to properly maintain, protect, repair or upgrade systems, or problems with transitioning to upgraded or replacement systems could cause delays in product fulfillment and reduced efficiency of our operations, could require significant capital investments to remediate the problem which may not be sufficient to cover all eventualities, and may have an adverse effect on our reputation, results of operations and financial condition. In addition, the use of employee-owned devices for communications as well as hybrid work arrangements, present additional operational risks to our Information Technology Systems, including, but not limited to, increased risks of cyber-attacks. Further, like other companies in the retail industry, we have in the past experienced, and we expect to continue to experience, cyber-attacks, including phishing, and other attempts to breach, or gain unauthorized access to, our systems. To date, these attacks have not had a material impact on our operations, but we cannot provide assurance that they will not have an impact in the future.
We also use Information Technology Systems to process financial information and results of operations for internal reporting purposes and to comply with regulatory financial reporting, legal and tax requirements. From time to time, we have expended, and expect to continue to expend, significant resources to modify, update and enhance our Information Technology Systems and to investigate and remediate vulnerabilities or other exposures. These modifications, updates and enhancements may cost more than initially expected and may not be effective in preventing issues and disruptions. Moreover, due to the complexity of our Information Technology Systems, the process of implementing modifications or enhancements can itself create a risk of systems disruptions and security issues. If Information Technology Systems suffer severe damage, disruption or shutdown and our business continuity plans, or those of our vendors, do not effectively resolve the issues in a timely manner, we could experience delays in reporting our financial results, which could result in lost revenues and profits, as well as reputational damage. Furthermore, we depend on Information Technology Systems and personal data collection for digital marketing, digital commerce, consumer engagement and the marketing and use of our digital products and services. We also rely on our ability to engage in electronic communications throughout the world between and among our employees as well as with other third parties, including customers, suppliers, vendors and consumers. Any interruption in Information Technology Systems may impede our ability to engage in the digital space and result in lost revenues, damage to our reputation, and loss of users.
We are subject to the risk our licensees may not generate expected sales or maintain the value of our brands.
We currently license, and expect to continue licensing, certain of our proprietary rights, such as trademarks or copyrighted material, to third parties. If our licensees fail to successfully market and sell licensed products, or fail to obtain sufficient capital or effectively manage their business operations, customer relationships, labor relationships, supplier relationships or credit risks, it could adversely affect our revenues, both directly from reduced royalties received and indirectly from reduced sales of our other products.
We also rely on our licensees to help preserve the value of our brands. Although we attempt to protect our brands through approval rights over the design, production processes, quality, packaging, merchandising, distribution, advertising and promotion of our licensed products, we cannot completely control the use of our licensed brands by our licensees. The misuse of a brand by or negative publicity involving a licensee could have a material adverse effect on that brand and on us.
2023 FORM 10-K 16
Table of Contents
Consolidation of retailers or concentration of retail market share among a few retailers may increase and concentrate our credit risk and impair our ability to sell products.
The athletic footwear, apparel and equipment retail markets in some countries are dominated by a few large athletic footwear, apparel and equipment retailers with many stores and accelerating digital commerce capabilities. The market shares of these retailers may increase through acquisitions and construction of additional stores and investments in digital capacity, and as a result of attrition as struggling retailers exit the market. Consolidation of our retailers will concentrate our credit risk with a smaller set of retailers, any of whom may experience declining sales or a shortage of liquidity. In addition, increasing market share concentration among a few retailers in a particular country or region increases the risk that if any one of them substantially reduces their purchases of our products, we may be unable to find sufficient retail outlets for our products to sustain the same level of sales and revenues.
If one or more of our counterparty financial institutions default on their obligations to us or fail, we may incur significant losses.
As part of our hedging activities, we enter into transactions involving derivative financial instruments, which may include forward contracts, commodity futures contracts, option contracts, collars and swaps with various financial institutions. In addition, we have significant amounts of cash, cash equivalents and other investments on deposit or in accounts with banks or other financial institutions in the United States and abroad. As a result, we are exposed to the risk of default by or failure of counterparty financial institutions. The risk of counterparty default or failure may be heightened during economic downturns and periods of uncertainty in the financial markets. If one of our counterparties were to become insolvent or file for bankruptcy, our ability to recover losses incurred as a result of default, or our assets deposited or held in accounts with such counterparty, may be limited by the counterparty’s liquidity or the applicable laws governing the insolvency or bankruptcy proceedings. In the event of default or failure of one or more of our counterparties, we could incur significant losses, which could negatively impact our results of operations and financial condition.
We rely on a concentrated source base of contract manufacturers to supply a significant portion of our footwear products.
As of May 31, 2023, our contract manufacturers operated 123 finished goods footwear factories located in 11 countries. We rely upon contract manufacturers, which we do not own or operate, to manufacture all of the footwear products we sell. For fiscal 2023, four footwear contract manufacturers each accounted for greater than 10% of footwear production and in the aggregate accounted for approximately 58% of NIKE Brand footwear production. Our ability to meet our customers’ needs depends on our ability to maintain a steady supply of products from our contract manufacturers. If one or more of our significant suppliers were to sever their relationship with us or significantly alter the terms of our relationship, including due to changes in applicable trade policies, or be unable to perform, we may not be able to obtain replacement products in a timely manner, which could have a material adverse effect on our business operations, sales, financial condition or results of operations. Additionally, if any of our primary footwear contract manufacturers fail to make timely shipments, do not meet our quality standards or otherwise fail to deliver us product in accordance with our plans, there could be a material adverse effect on our results of operations.
Certain of our footwear contract manufacturers are highly specialized and only produce a specific type of product. Such contract manufacturers may go out of business if consumer preferences or market conditions change such that there is no longer sufficient demand for the types of products they produce. If, in the future, the relevant products are again in demand and the specialized contract manufacturers no longer exist, we may not be able to locate replacement facilities to manufacture certain footwear products in a timely manner or at all, which could have a material adverse effect on our sales, financial condition or results of operations.
The market for prime real estate is competitive.
Our ability to effectively obtain real estate to open new retail stores and otherwise conduct our operations, both domestically and internationally, depends on the availability of real estate that meets our criteria for traffic, square footage, co-tenancies, lease economics, demographics and other factors. We also must be able to effectively renew our existing real estate leases. In addition, from time to time, we seek to downsize, consolidate, reposition or close some of our real estate locations, which may require modification of an existing lease. Failure to secure adequate new locations or successfully modify leases for existing locations, or failure to effectively manage the profitability of our existing fleet of retail stores, could have an adverse effect on our operating results and financial condition.
Additionally, the economic environment may make it difficult to determine the fair market rent of real estate properties domestically and internationally. This could impact the quality of our decisions to exercise lease options at previously negotiated rents and to renew expiring leases at negotiated rents. Any adverse effect on the quality of these decisions could impact our ability to retain real estate locations adequate to meet our targets or efficiently manage the profitability of our existing fleet of stores, which could have an adverse effect on our operating results and financial condition.
2023 FORM 10-K 17
Table of Contents
The success of our business depends, in part, on high-quality employees, including key personnel as well as our ability to maintain our workplace culture and values.
Our success depends in part on the continued service of high-quality employees, including key executive officers and personnel. The loss of the services of key individuals, or any negative perception with respect to these individuals, or our workplace culture or values, could harm our business. Our success also depends on our ability to recruit, retain and engage our personnel sufficiently, both to maintain our current business and to execute our strategic initiatives. Competition for employees in our industry is intense and we may not be successful in attracting and retaining such personnel. Changes to our current and future work models may not meet the needs or expectations of our employees or may not be perceived as favorable compared to other companies’ policies, which could negatively impact our ability to attract, hire and retain our employees. In addition, shifts in U.S. immigration policy could negatively impact our ability to attract, hire and retain highly skilled employees who are from outside the United States. We also believe that our corporate culture has been a key driver of our success, and we have invested substantial time and resources in building, maintaining and evolving our culture. Any failure to preserve and evolve our culture could negatively affect our future success, including our ability to retain and recruit employees.
Our business operations and financial performance could be adversely affected by changes in our relationship with our workforce or changes to United States or foreign employment regulations.
We have significant exposure to changes in domestic and foreign laws governing our relationships with our workforce, including wage and hour laws and regulations, fair labor standards, minimum wage requirements, overtime pay, unemployment tax rates, workers’ compensation rates, citizenship requirements and payroll taxes, which could have a direct impact on our operating costs. A significant increase in minimum wage or overtime rates in countries where we have workforce could have a significant impact on our operating costs and may require that we relocate those operations or take other steps to mitigate such increases, all of which may cause us to incur additional costs. There is also a risk of potential claims that we have violated laws related to discrimination and harassment, health and safety, wage and hour laws, criminal activity, personal injury and other claims. In addition, if there were a significant increase in the number of members of our workforce who are members of labor organizations or become parties to collective bargaining agreements, we could be vulnerable to a strike, work stoppage or other labor action, which could have an adverse effect on our business.
Risks Related to Operating a Global Business
Our international operations involve inherent risks which could result in harm to our business.
Nearly all of our athletic footwear and apparel is manufactured outside of the United States, and the majority of our products are sold outside of the United States. Accordingly, we are subject to the risks generally associated with global trade and doing business abroad, which include foreign laws and regulations, varying consumer preferences across geographic regions, political tensions, unrest, disruptions or delays in cross-border shipments and changes in economic conditions in countries in which our products are manufactured or where we sell products. Changes in U.S. or international social, political, regulatory and economic conditions could impact our business, reputation, financial condition and results of operations. In particular, political and economic instability, geopolitical conflicts, political unrest, civil strife, terrorist activity, acts of war, public corruption, expropriation, nationalism and other economic or political uncertainties in the United States or internationally could interrupt and negatively affect the sale of our products or other business operations. Any negative sentiment toward the United States as a result of any such changes could also adversely affect our business.
In addition, disease outbreaks, terrorist acts and military conflict have increased the risks of doing business abroad. These factors, among others, could affect our ability to manufacture products or procure materials, or our costs for manufacturing and procuring materials, our ability to import products, our ability to sell products in international markets and our cost of doing business. If any of these or other factors make the conduct of business in a particular country undesirable or impractical, our business could be adversely affected.
Our products are subject to risks associated with overseas sourcing, manufacturing and financing.
The principal materials used in our footwear products — natural and synthetic rubber, plastic compounds, foam cushioning materials, natural and synthetic leather, nylon, polyester and natural fiber textiles and polyurethane films — are locally available to manufacturers. The principal materials used in our apparel products — natural and synthetic fabrics, yarns and threads (both virgin and recycled), specialized performance fabrics designed to efficiently wick moisture away from the body, retain heat and repel rain and/or snow as well as plastic and metal hardware — are also available in countries where our manufacturing takes place. Both our apparel and footwear products are dependent upon the ability of our contract manufacturers to locate, train, employ and retain adequate personnel. NIKE contract manufacturers and materials suppliers buy raw materials and are subject to wage rates and other labor standards that are oftentimes regulated by the governments of the countries in which our products are manufactured.
There could be a significant disruption in the supply of fabrics or raw materials from current sources or, in the event of a disruption or heightened competition for such materials, our contract manufacturers might not be able to locate alternative suppliers of materials of comparable quality at an acceptable price or at all. Further, our contract manufacturers have experienced and may continue to experience in the future, unexpected closures, unexpected increases in work wages or other
2023 FORM 10-K 18
Table of Contents
changes in labor standards, whether government mandated or otherwise, and increases in compliance costs due to governmental regulation concerning certain metals, fabrics or raw materials used in the manufacturing of our products. In addition, we cannot be certain that manufacturers that we do not contract and that we refer to as “unaffiliated manufacturers” will be able to fill our orders in a timely manner. If we experience significant increases in demand, or reductions in the availability of materials, or need to replace an existing contract manufacturer or materials supplier, there can be no assurance additional supplies of fabrics or raw materials or additional manufacturing capacity will be available when required on terms acceptable to us, or at all, or that any contract manufacturer, unaffiliated manufacturer, or any materials supplier would allocate sufficient capacity to us in order to meet our requirements. In addition, even if we are able to expand existing or find new manufacturing capacity or sources of materials, we may encounter delays in production and added costs as a result of the time it takes to train suppliers and manufacturers in our methods, products, quality control standards and labor, health and safety standards. Any delays, interruption or increased costs in labor or wages, in the supply of materials or in the manufacturing of our products could have an adverse effect on our ability to meet retail customer and consumer demand for our products and result in lower revenues and net income both in the short- and long-term.
Because contract manufacturers make a majority of our products outside of our principal sales markets, our products must be transported by third parties over large geographic distances. Delays in the shipment or delivery of our products due to the availability of transportation, container shortages, labor shortages, including work stoppages or port strikes, infrastructure and port congestion or other factors, and costs and delays associated with consolidating or transitioning between manufacturers, have adversely impacted, and could in the future adversely impact the availability of our products and, in turn, our financial performance. In addition, delays in the shipment or delivery of our products, manufacturing delays or unexpected demand for our products have required us, and may in the future require us to use faster, but more expensive, transportation methods such as air freight, which could adversely affect our profit margins. The cost of oil is a significant component in manufacturing and transportation costs, so increases in the price of petroleum products can adversely affect our profit margins. Changes in U.S. trade policies, including modifications to import tariffs and existing trade policies and agreements, have also had, and could continue to have a significant impact on our activities in foreign jurisdictions, and could adversely affect our reputation or results of operations.
Our success depends on our global distribution facilities.
We distribute our products to customers directly from the factory and through distribution centers located throughout the world. Our ability to meet customer expectations, manage inventory, complete sales and achieve objectives for operating efficiencies and growth, particularly in emerging markets, depends on the proper operation of our distribution facilities, the development or expansion of additional distribution capabilities and the timely performance of services by third parties (including those involved in shipping product to and from our distribution facilities). Our distribution facilities have in the past and could in the future be interrupted by information technology problems, disasters such as earthquakes or fires or outbreaks of disease or government actions taken to mitigate their spread. Any significant failure in our distribution facilities could result in an adverse effect on our business. We maintain business interruption insurance, but it may not adequately protect us from adverse effects caused by significant disruptions in our distribution facilities.
Legal, Regulatory, and Compliance Risks
We are subject to a complex array of laws and regulations and litigation and other legal and regulatory proceedings, which could have an adverse effect on our business, financial condition and results of operations.
As a multinational corporation with operations and distribution channels throughout the world, we are subject to and must comply with extensive laws and regulations in the United States and other jurisdictions in which we have operations and distribution channels. If we or our employees, agents, suppliers, and other partners fail to comply with any of these laws or regulations, such failure could subject us to fines, sanctions or other penalties that could negatively affect our reputation, business, financial condition and results of operations. Furthermore, laws, regulations and policies and the interpretation of such, can conflict among jurisdictions and compliance in one jurisdiction may result in legal or reputational risks in another jurisdiction. We are involved in various types of claims, lawsuits, regulatory proceedings and government investigations relating to our business, our products and the actions of our employees and representatives, including contractual and employment relationships, product liability, antitrust, trademark rights and a variety of other matters. It is not possible to predict with certainty the outcome of any such legal or regulatory proceedings or investigations, and we could in the future incur judgments, fines or penalties, or enter into settlements of lawsuits and claims that could have a material adverse effect on our business, financial condition and results of operations and negatively impact our reputation. The global nature of our business means legal and compliance risks, such as anti-bribery, anti-corruption, fraud, trade, environmental, competition, privacy and other regulatory matters, will continue to exist and additional legal proceedings and other contingencies have and will continue to arise from time to time, which could adversely affect us. In addition, the adoption of new laws or regulations, or changes in the interpretation of existing laws or regulations, may result in significant unanticipated legal and reputational risks. Moreover, the regulation of certain transactions we engage in, including those involving virtual goods and cryptocurrencies, remains in an early stage and subject to significant uncertainty. As a result, we are required to exercise our judgment as to whether or how certain laws or regulations apply, or may in the future
2023 FORM 10-K 19
Table of Contents
apply, and it is possible that legislators, regulators and courts may disagree with our conclusions. Any current or future legal or regulatory proceedings could divert management’s attention from our operations and result in substantial legal fees.
Changes to U.S. or other countries’ trade policies and tariff and import/export regulations or our failure to comply with such regulations may have a material adverse effect on our reputation, business, financial condition and results of operations.
Changes in the U.S. government’s import and export policies, including trade restrictions, sanctions and countersanctions, increased tariffs or quotas, embargoes, safeguards or customs restrictions, could require us to change the way we conduct business and adversely affect our results of operations.
In addition, changes in laws and policies governing foreign trade, manufacturing, development and investment in the territories or countries where we currently sell our products or conduct our business could adversely affect our business. U.S. presidential administrations have instituted or proposed changes in trade policies that include the negotiation or termination of trade agreements, the imposition of higher tariffs on imports into the U.S., economic sanctions on individuals, corporations or countries, and other government regulations affecting trade between the U.S. and other countries where we conduct our business. It may be time-consuming and expensive for us to alter our business operations in order to adapt to or comply with any such changes.
Changes or proposed changes in U.S. or other countries’ trade policies may result in restrictions and economic disincentives on international trade. Tariffs and other changes in U.S. trade policy have in the past and could in the future trigger retaliatory actions by affected countries, and certain foreign governments have instituted or are considering imposing retaliatory measures on certain U.S. goods. Further, any emerging protectionist or nationalist trends either in the United States or in other countries could affect the trade environment. The Company, similar to many other multinational corporations, does a significant amount of business that would be impacted by changes to the trade policies of the United States and foreign countries (including governmental action related to tariffs, international trade agreements, or economic sanctions). Such changes have the potential to adversely impact the U.S. economy or certain sectors thereof or the economy of another country in which we conduct operations, our industry and the global demand for our products, and as a result, could have a material adverse effect on our business, financial condition and results of operations.
In addition, many of our imported products are subject to duties, tariffs or quotas that affect the cost and quantity of various types of goods imported into the United States and other countries. Any country in which our products are produced or sold may eliminate, adjust or impose new quotas, duties, tariffs, safeguard measures, anti-dumping duties, cargo restrictions to prevent terrorism, restrictions on the transfer of currency, climate change legislation, product safety regulations or other charges or restrictions, any of which could have an adverse effect on our results of operations and financial condition.
Furthermore, we are subject to the FCPA as well as the anti-corruption laws of other countries in which we operate. Although we implement policies and procedures designed to promote compliance with these laws, our employees, independent contractors, contract manufacturers, suppliers and agents, as well as those companies to which we outsource certain of our business operations, may take actions in violation of our policies. Any such violation could result in sanctions or other penalties and have an adverse effect on our business, reputation and operating results.
Failure to adequately protect or enforce our intellectual property rights could adversely affect our business.
We periodically discover counterfeit reproductions of our products or products that otherwise infringe our intellectual property rights. If we are unsuccessful in enforcing our intellectual property rights, continued sales of these products could adversely affect our sales and our brand and could result in a shift of consumer preference away from our products.
The actions we take to establish and protect our intellectual property rights may not be adequate to prevent imitation of our products by others. We also may be unable to prevent others from seeking to block sales of our products as violations of proprietary rights.
We may be subject to liability if third parties successfully claim we infringe their intellectual property rights. Defending infringement claims could be expensive and time-consuming and might result in our entering into costly license agreements. We also may be subject to significant damages or injunctions against development, manufacturing, use, importation and/or sale of certain products.
We take various actions to prevent the unauthorized use and/or disclosure of our confidential information and intellectual property rights. These actions include contractual measures such as entering into non-disclosure and non-compete agreements and agreements relating to our collaborations with third parties and providing confidential information awareness training. Our controls and efforts to prevent unauthorized use and/or disclosure of confidential information and intellectual property rights might not always be effective. For example, confidential information related to business strategy, innovations, new technologies, mergers and acquisitions, unpublished financial results or personal data could be prematurely, inadvertently, or improperly used and/or disclosed, resulting in a loss of reputation, loss of intellectual property rights, a decline in our stock price and/or a negative impact on our market position, and could lead to damages, fines, penalties or injunctions. In addition, new products we offer, such as virtual goods, may raise various novel intellectual property law considerations, including adequacy and scope of assignment, licensing, transfer, copyright and other right-of-use issues.
2023 FORM 10-K 20
Table of Contents
In addition, the laws of certain countries may not protect or allow enforcement of intellectual property rights to the same extent as the laws of the United States. We may face significant expenses and liability in connection with the protection of our intellectual property rights, including outside the United States, and if we are unable to successfully protect our rights or resolve intellectual property conflicts with others, our business or financial condition may be adversely affected.
We are subject to data security and privacy risks that could negatively affect our results, operations or reputation.
In addition to our own sensitive and proprietary business information, we handle transactional and personal information about our wholesale customers and consumers and users of our digital experiences, which include online distribution channels and product engagement, adaptive products and personal fitness applications. Hackers and data thieves are increasingly sophisticated and operate social engineering, such as phishing, and large-scale, complex automated attacks that can evade detection for long periods of time. Any breach of our or our service providers’ networks, or other vendor systems, may result in the loss of confidential business and financial data, misappropriation of our consumers’, users’ or employees’ personal information or a disruption of our business. Any of these outcomes could have a material adverse effect on our business, including unwanted media attention, impairment of our consumer and customer relationships, damage to our reputation; resulting in lost sales and consumers, fines, lawsuits, or significant legal and remediation expenses. We also may need to expend significant resources to protect against, respond to and/or redress problems caused by any breach.
In addition, we must comply with increasingly complex and rigorous, and sometimes conflicting, regulatory standards enacted to protect business and personal data in the United States, Europe and elsewhere. For example, the European Union adopted the General Data Protection Regulation (the “GDPR”); the United Kingdom enacted the UK General Data Protection Regulation (which implements the GDPR into UK law); several states in the United States have passed data privacy laws; China enacted the Data Security Law and Personal Information Protection Law; and additional jurisdictions have adopted or are considering proposing or adopting similar regulations. These laws impose additional obligations on companies regarding the handling of personal data and provide certain individual privacy rights to persons whose data is stored. Compliance with existing, proposed and recently enacted laws and regulations can be costly and time consuming, and any failure to comply with these regulatory standards could subject us to legal, operational and reputational risks. Misuse of or failure to secure personal information could also result in violation of data privacy laws and regulations, proceedings against the Company by governmental entities or others, imposition of fines by governmental authorities and damage to our reputation and credibility and could have a negative impact on revenues and profits.
We could be subject to changes in tax rates, adoption of new tax laws, additional tax liabilities or increased volatility in our effective tax rate.
We earn a substantial portion of our income in foreign countries and, as such, we are subject to the tax laws in the United States and numerous foreign jurisdictions. Current economic and political conditions make tax laws and regulations, or their interpretation and application, in any jurisdiction subject to significant change.
Proposals to reform U.S. and foreign tax laws could significantly impact how U.S. multinational corporations are taxed on global earnings and could increase the U.S. corporate tax rate. For example, the Organization for Economic Co-operation and Development (OECD) and the G20 Inclusive Framework on Base Erosion and Profit Shifting (the “Inclusive Framework”) has put forth two proposals—Pillar One and Pillar Two—that revise the existing profit allocation and nexus rules and ensure a minimal level of taxation, respectively. On December 12, 2022, the European Union member states agreed to implement the Inclusive Framework’s global corporate minimum tax rate of 15%. Other countries are also actively considering changes to their tax laws to adopt certain parts of the Inclusive Framework’s proposals. Although we cannot predict whether or in what form these proposals will be enacted into law, these changes, if enacted into law, could have an adverse impact on our effective tax rate, income tax expense and cash flows.
Portions of our operations are subject to a reduced tax rate or are under a tax holiday. We also utilize tax rulings and other agreements to obtain certainty in treatment of certain tax matters. Tax holidays and rulings can expire from time to time and may be extended when certain conditions are met, or terminated if certain conditions are not met. The impact of any changes in conditions would be the loss of certainty in treatment thus potentially impacting our effective income tax rate. For example, in January 2019, the European Commission opened a formal investigation to examine whether the Netherlands has breached State Aid rules when granting certain tax rulings to the Company. If this matter is adversely resolved, the Netherlands may be required to assess additional amounts with respect to prior periods, and the Company’s income taxes related to prior periods in the Netherlands could increase.
We are also subject to the examination of our tax returns by the United States Internal Revenue Service (“IRS”) and other tax authorities. We regularly assess the likelihood of an adverse outcome resulting from these examinations to determine the adequacy of our provision for income taxes. Although we believe our tax provisions are adequate, the final determination of tax audits and any related disputes could be materially different from our historical income tax provisions and accruals. The results of audits or related disputes could have an adverse effect on our financial statements for the period or periods for which the applicable final determinations are made. For example, we and our subsidiaries are also engaged in a number of intercompany transactions across multiple tax jurisdictions. Although we believe we have clearly reflected the economics of these transactions
2023 FORM 10-K 21
Table of Contents
and the proper local transfer pricing documentation is in place, tax authorities may propose and sustain adjustments that could result in changes that may impact our mix of earnings in countries with differing statutory tax rates.
Failure of our contractors or our licensees’ contractors to comply with our code of conduct, local laws and other standards could harm our business.
We have license agreements that permit independent parties to manufacture or contract for the manufacture of products using our intellectual property. We require the contractors that directly manufacture our products and our licensees that make products using our intellectual property (including, indirectly, their contract manufacturers) to comply with a code of conduct and other environmental, human rights, health and safety standards for the benefit of workers. We also require our contract manufacturers and the contractors of our licensees to comply with applicable standards for product safety. Notwithstanding their contractual obligations, from time to time contractors may not comply with such standards or applicable local law or our licensees may fail to enforce such standards or applicable local law on their contractors. If one or more of our direct or indirect contractors violates or fails to comply with, or is accused of violating or failing to comply with, such standards and laws, this could harm our reputation or result in a product recall and, as a result, could have an adverse effect on our sales and financial condition. Negative publicity regarding production methods, alleged unethical or illegal practices or workplace or related conditions of any of our suppliers, manufacturers or licensees could adversely affect our brand image and sales, force us to locate alternative suppliers, manufacturers or licenses or result in the imposition of additional regulations, including new or additional quotas, tariffs, sanctions, product safety regulations or other regulatory measures, by governmental authorities.
Risks Related to Our Securities, Investments and Liquidity
Our financial results may be adversely affected if substantial investments in businesses and operations fail to produce expected returns.
From time to time, we may invest in technology, business infrastructure, new businesses or capabilities, product offering and manufacturing innovation and expansion of existing businesses, such as our NIKE Direct operations, which require substantial cash investments and management attention. We believe cost-effective investments are essential to business growth and profitability; however, significant investments are subject to typical risks and uncertainties inherent in developing a new business or expanding an existing business. The failure of any significant investment to provide expected returns or profitability could have a material adverse effect on our financial results and divert management attention from more profitable business operations. See also “Our NIKE Direct operations have required and will continue to require a substantial investment and commitment of resources and are subject to numerous risks and uncertainties.”
The sale of a large number of shares of common stock by our principal shareholder could depress the market price of our common stock.
As of June 30, 2023, Swoosh, LLC beneficially owned approximately 77% of our Class A Common Stock. If, on June 30, 2023, all of these shares were converted into Class B Common Stock, Swoosh, LLC’s commensurate ownership percentage of our Class B Common Stock would be approximately 16%. The shares are available for resale, subject to the requirements of the U.S. securities laws and the terms of the limited liability company agreement governing Swoosh, LLC. The sale or prospect of a sale of a substantial number of these shares could have an adverse effect on the market price of our common stock. Swoosh, LLC was formed by Philip H. Knight, our Chairman Emeritus, to hold the majority of his shares of Class A Common Stock. Mr. Knight does not have voting rights with respect to Swoosh, LLC, although Travis Knight, his son and a NIKE director, has a significant role in the management of the Class A Common Stock owned by Swoosh, LLC.
Changes in our credit ratings or macroeconomic conditions may affect our liquidity, increasing borrowing costs and limiting our financing options.
Our long-term debt is currently rated Investment Grade by Standard & Poor’s and Moody’s Investors Service. If our credit ratings are lowered, borrowing costs for our existing facilities or for future long-term debt or short-term credit facilities may increase and our financing options, including our access to credit or capital markets, could be adversely affected. We may also be subject to restrictive covenants that would reduce our flexibility to, among other things, incur additional indebtedness, make restricted payments, pledge assets as security, make investments, loans, advances, guarantees and acquisitions, undergo fundamental changes and enter into transactions with affiliates. Failure to comply with such covenants could result in a default, and as a result, the commitments of our lenders under our credit agreements may be terminated and the maturity of amounts owed may be accelerated. In addition, macroeconomic conditions, such as increased volatility or disruption in the credit or capital markets, could adversely affect our ability to refinance existing debt.
If our internal controls are ineffective, our operating results could be adversely affected.
Our internal control over financial reporting may not prevent or detect misstatements because of its inherent limitations, including the possibility of human error, the circumvention or overriding of controls or fraud. Even effective internal controls can provide only reasonable assurance with respect to the preparation and fair presentation of financial statements. If we fail to maintain the adequacy of our internal controls, including any failure to implement required new or improved controls, or if we experience
2023 FORM 10-K 22
Table of Contents
difficulties in their implementation, our business and operating results could be harmed and we could fail to meet our financial reporting obligations.
If our estimates or judgments relating to our critical accounting estimates prove to be incorrect, our operating results could be adversely affected.
The preparation of financial statements in conformity with accounting principles generally accepted in the United States requires management to make estimates and assumptions that affect the amounts reported in the consolidated financial statements and accompanying notes. We base our estimates on historical experience and on various other assumptions we believe to be reasonable under the circumstances, as provided in “Management’s Discussion and Analysis of Financial Condition and Results of Operations”. The results of these estimates form the basis for making judgments about the carrying values of assets, liabilities and equity, and the amount of revenues and expenses that are not readily apparent from other sources. Significant assumptions and estimates used in preparing our consolidated financial statements include those related to revenue recognition, inventory reserves, hedge accounting for derivatives, income taxes and other contingencies. Our operating results may be adversely affected if our assumptions change or if actual circumstances differ from those in our assumptions, which could cause our operating results to fall below the expectations of securities analysts and investors, resulting in a decline in the price of our Class B Common Stock.
Anti-takeover provisions may impair an acquisition of the Company or reduce the price of our common stock.
There are provisions within our articles of incorporation and Oregon law intended to protect shareholder interests by providing the Board of Directors a means to attempt to deny coercive takeover attempts or to negotiate with a potential acquirer in order to obtain more favorable terms. Such provisions include a control share acquisition statute, a freeze-out statute, two classes of stock that vote separately on certain issues, and the fact that holders of Class A Common Stock elect three-quarters of the Board of Directors rounded down to the next whole number. However, such provisions could discourage, delay or prevent an unsolicited merger, acquisition or other change in control of the Company that some shareholders might believe to be in their best interests or in which shareholders might receive a premium for their common stock over the prevailing market price. These provisions could also discourage proxy contests for control of the Company.
We may fail to meet market expectations, which could cause the price of our stock to decline.
Our Class B Common Stock is traded publicly, and at any given time various securities analysts follow our financial results and issue reports on us. These reports include information about our historical financial results as well as analysts’ opinions of our future performance, which may, in part, be based upon any guidance we have provided. Analysts’ estimates are often different from our estimates or expectations. If our operating results are below the estimates or expectations of public market analysts and investors, our stock price could decline. In the past, securities class action litigation has been brought against NIKE and other companies following a decline in the market price of their securities. If our stock price is volatile for any reason, we may become involved in this type of litigation in the future. Any litigation could result in reputational damage, substantial costs and a diversion of management’s attention and resources needed to successfully run our business.
2023 FORM 10-K 23
Table of Contents
ITEM 1B. UNRESOLVED STAFF COMMENTS
None.
ITEM 2. PROPERTIES
The following is a summary of principal properties owned or leased by NIKE:
The NIKE World Campus, owned by NIKE and located near Beaverton, Oregon, USA, is an approximately 400-acre site consisting of over 40 buildings which, together with adjacent leased properties, functions as our world headquarters and is occupied by approximately 11,400 employees engaged in management, research, design, development, marketing, finance and other administrative functions serving nearly all of our segments. We lease a similar, but smaller, administrative facility in Hilversum, the Netherlands, which serves as the headquarters for our Europe, Middle East & Africa geography and management of certain brand functions for our non-U.S. operations. We also lease an office complex in Shanghai, China, our headquarters for our Greater China geography, occupied by employees focused on implementing our wholesale, NIKE Direct and merchandising strategies in the region, among other functions.
In the United States, NIKE has eight significant distribution centers. Five are located in or near Memphis, Tennessee, two of which are owned and three of which are leased. Two other distribution centers, one located in Indianapolis, Indiana and one located in Dayton, Tennessee, are leased and operated by third-party logistics providers. One distribution center for Converse is located in Ontario, California, which is leased. NIKE has a number of distribution facilities outside the United States, some of which are leased and operated by third-party logistics providers. The most significant distribution facilities outside the United States are located in Laakdal, Belgium; Taicang, China; Tomisato, Japan and Icheon, Korea, all of which we own.
Air Manufacturing Innovation manufactures cushioning components used in footwear at NIKE-owned and leased facilities located near Beaverton, Oregon, and in Dong Nai Province, Vietnam, as well as at NIKE-owned facilities in St. Charles, Missouri.
Aside from the principal properties described above, we lease many offices worldwide for sales and administrative purposes. We lease approximately 1,027 retail stores worldwide, which primarily consist of factory stores. See “United States Market” and “International Markets” for additional information regarding our retail stores. Our leases expire at various dates through the fiscal year 2052.
ITEM 3. LEGAL PROCEEDINGS
We do not believe there are any material pending legal proceedings, other than ordinary routine litigation incidental to our business, to which we are a party or of which any of our property is the subject. Refer to Note 16 — Commitments and Contingencies in the accompanying Notes to the Consolidated Financial Statements for further information.
ITEM 4. MINE SAFETY DISCLOSURES
Not applicable.
2023 FORM 10-K 24
Table of Contents
PART II
ITEM 5. MARKET FOR REGISTRANT’S COMMON EQUITY, RELATED STOCKHOLDER MATTERS AND ISSUER PURCHASES OF EQUITY SECURITIES
NIKE’s Class B Common Stock is listed on the New York Stock Exchange and trades under the symbol NKE. At July 12, 2023, there were 21,813 holders of record of NIKE’s Class B Common Stock and 15 holders of record of NIKE’s Class A Common Stock. These figures do not include beneficial owners who hold shares in nominee name. The Class A Common Stock is not publicly traded, but each share is convertible upon request of the holder into one share of Class B Common Stock. Refer to our Consolidated Statements of Shareholders’ Equity for dividends declared on the Class A and Class B Common Stock.
In August 2022, the Company terminated the previous four-year, $15 billion share repurchase program approved by the Board of Directors in June 2018. Prior to the program’s termination, the Company purchased 6.5 million shares at an average price of $109.85 per share for a total approximate cost of $710.0 million during the first quarter of fiscal 2023 and 83.8 million shares at an average price of $111.82 per share for a total approximate cost of $9.4 billion during the term of this program.
Upon termination of the $15 billion program, the Company began purchasing shares under a new four-year, $18 billion share repurchase program authorized by the Board of Directors in June 2022. As of May 31, 2023, the Company had repurchased 43.5 million shares at an average price of $110.38 per share for a total approximate cost of $4.8 billion under the new program.
Repurchases under the Company’s new program will be made in open market or privately negotiated transactions in compliance with the Securities and Exchange Commission Rule 10b-18, subject to market conditions, applicable legal requirements and other relevant factors. The new share repurchase program does not obligate the Company to acquire any particular amount of common stock, and it may be suspended at any time at the Company’s discretion.
All share repurchases were made under NIKE’s publicly announced program, and there are no other programs under which the Company repurchases shares. The following table presents a summary of share repurchases made during the quarter ended May 31, 2023:
| PERIOD | TOTAL NUMBER OF SHARES PURCHASED | AVERAGE PRICE PAID PER SHARE | APPROXIMATE DOLLAR VALUE OF SHARES THAT MAY YET BE PURCHASED UNDER THE PLANS OR PROGRAMS (IN MILLIONS) | ||||||||
| March 1 — March 31, 2023 | 4,118,427 | $ | 120.04 | $ | 14,099 | ||||||
| April 1 — April 30, 2023 | 3,282,288 | $ | 125.01 | $ | 13,689 | ||||||
| May 1 — May 31, 2023 | 4,134,824 | $ | 118.30 | $ | 13,200 | ||||||
| 11,535,539 | $ | 120.83 | |||||||||
2023 FORM 10-K 25
Table of Contents
PERFORMANCE GRAPH
The following graph demonstrates a five-year comparison of cumulative total returns for NIKE’s Class B Common Stock; the Standard & Poor’s 500 Stock Index; the Dow Jones U.S. Footwear Index; and the Standard & Poor’s Apparel, Accessories & Luxury Goods Index. The graph assumes an investment of $100 on May 31, 2018, in each of the indices and our Class B Common Stock. Each of the indices assumes that all dividends were reinvested on the day of issuance.
COMPARISON OF 5-YEAR CUMULATIVE TOTAL RETURN AMONG NIKE, INC.; S&P 500 INDEX; THE DOW JONES U.S. FOOTWEAR INDEX; AND S&P APPAREL, ACCESSORIES & LUXURY GOODS INDEX
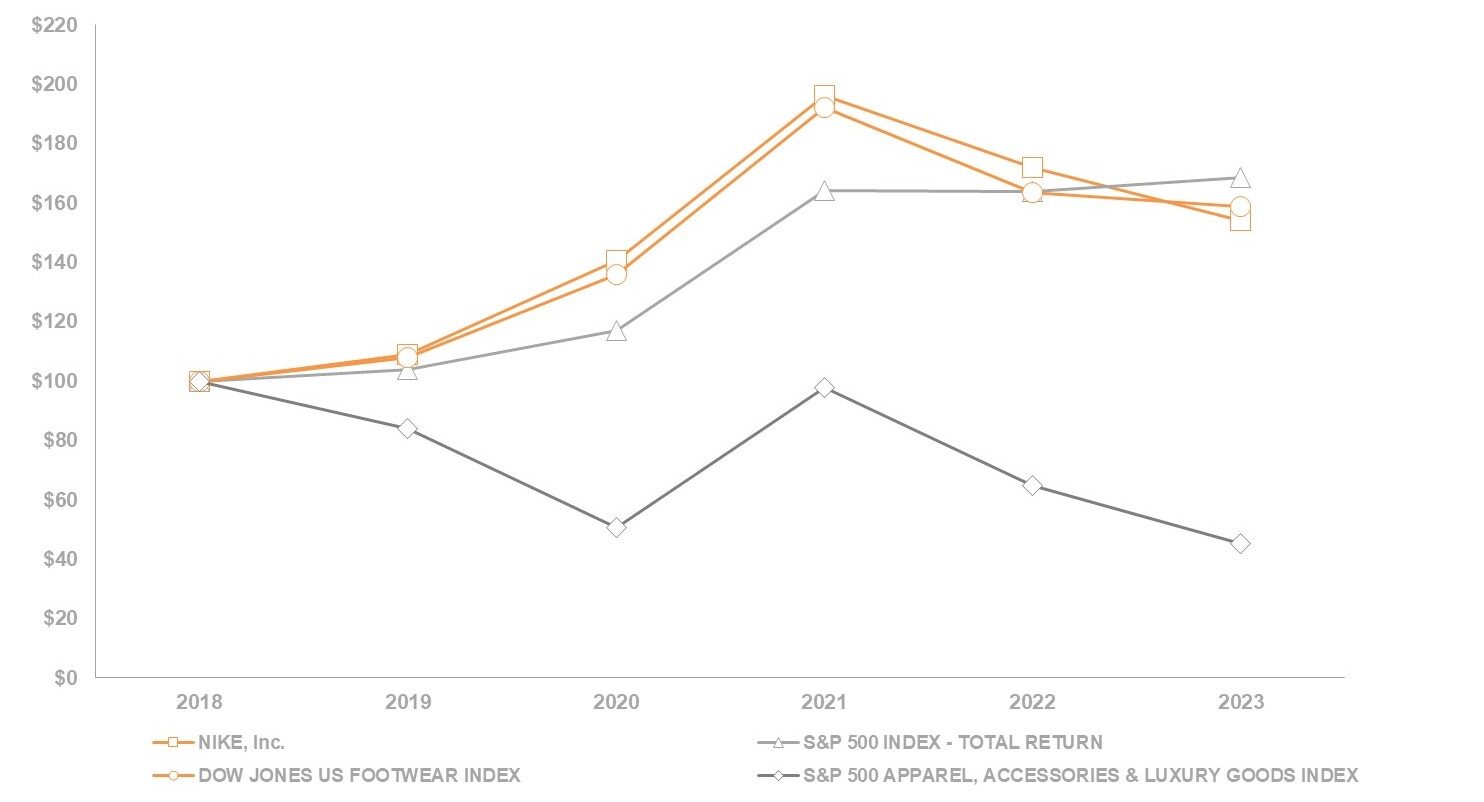
The Dow Jones U.S. Footwear Index consists of NIKE, Crocs Inc., Deckers Outdoor Corporation and Skechers U.S.A., Inc. Because NIKE is part of the Dow Jones U.S. Footwear Index, the price and returns of NIKE stock have a substantial effect on this index. The Standard & Poor’s Apparel, Accessories & Luxury Goods Index consists of Ralph Lauren Corporation, Tapestry, Inc. and V.F. Corporation. The Dow Jones U.S. Footwear Index and the Standard & Poor’s Apparel, Accessories & Luxury Goods Index include companies in two major lines of business in which the Company competes. The indices do not encompass all of the Company’s competitors, nor all product categories and lines of business in which the Company is engaged.
The stock performance shown on the performance graph above is not necessarily indicative of future performance. The Company will not make or endorse any predictions as to future stock performance.
The performance graph above is being furnished solely to accompany this Annual Report pursuant to Item 201(e) of Regulation S-K, is not being filed for purposes of Section 18 of the Securities Exchange Act of 1934, as amended, and is not to be incorporated by reference into any filing of the Company, whether made before or after the date hereof, regardless of any general incorporation language in such filing.
2023 FORM 10-K 26
Table of Contents
ITEM 6. [RESERVED]
2023 FORM 10-K 27
Table of Contents
ITEM 7. MANAGEMENT’S DISCUSSION AND ANALYSIS OF FINANCIAL CONDITION AND RESULTS OF OPERATIONS
OVERVIEW
NIKE designs, develops, markets and sells athletic footwear, apparel, equipment, accessories and services worldwide. We are the largest seller of athletic footwear and apparel in the world. We sell our products through NIKE Direct operations, which is comprised of both NIKE-owned retail stores and sales through our digital platforms (also referred to as “NIKE Brand Digital”), to wholesale accounts and to a mix of independent distributors, licensees and sales representatives in nearly all countries around the world. Our goal is to deliver value to our shareholders by building a profitable global portfolio of branded footwear, apparel, equipment and accessories businesses. Our strategy is to achieve long-term revenue growth by creating innovative, “must-have” products, building deep personal consumer connections with our brands and delivering compelling consumer experiences through digital platforms and at retail.
Through the Consumer Direct Acceleration strategy, we are focused on creating the marketplace of the future with more premium, consistent and seamless consumer experiences, leading with digital and our owned stores, as well as select wholesale partners. In addition, our product creation and marketing organizations are aligned to a consumer construct focused on sports dimensions through Men’s, Women’s and Kids’, which allows us to better serve consumer needs. We continue to invest in a new Enterprise Resource Planning Platform, data and analytics, demand sensing, insight gathering, and other areas to create an end-to-end technology foundation, which we believe will further accelerate our digital transformation. We believe this unified approach will accelerate growth and unlock more efficiency for our business, while driving speed and responsiveness as we serve consumers globally.
FINANCIAL HIGHLIGHTS
•In fiscal 2023, NIKE, Inc. achieved record Revenues of $51.2 billion, which increased 10% and 16% on a reported and currency-neutral basis, respectively
•NIKE Direct revenues grew 14% from $18.7 billion in fiscal 2022 to $21.3 billion in fiscal 2023, and represented approximately 44% of total NIKE Brand revenues for fiscal 2023
•Gross margin for the fiscal year decreased 250 basis points to 43.5% primarily driven by higher product costs, higher markdowns and unfavorable changes in foreign currency exchange rates, partially offset by strategic pricing actions
•Inventories as of May 31, 2023 were $8.5 billion, flat compared to the prior year, driven by the actions we took throughout fiscal 2023 to manage inventory levels
•We returned $7.5 billion to our shareholders in fiscal 2023 through share repurchases and dividends
•Return on Invested Capital (“ROIC”) as of May 31, 2023 was 31.5% compared to 46.5% as of May 31, 2022. ROIC is considered a non-GAAP financial measure, see “Use of Non-GAAP Financial Measures” for further information.
For discussion related to the results of operations and changes in financial condition for fiscal 2022 compared to fiscal 2021 refer to Part II, Item 7. Management’s Discussion and Analysis of Financial Condition and Results of Operations in our fiscal 2022 Form 10-K, which was filed with the United States Securities and Exchange Commission on July 21, 2022.
CURRENT ECONOMIC CONDITIONS AND MARKET DYNAMICS
•Consumer Spending: Our fiscal 2023 growth in Revenues reflects strong demand for our products despite ongoing uncertainty in the global economy. We will continue to closely monitor macroeconomic conditions, including potential impacts of inflation and rising interest rates on consumer behavior.
•Inflationary Pressures: Inflationary pressures, including higher product input, freight and logistics costs negatively impacted gross margin for fiscal 2023. The strategic pricing actions we have taken partially offset the impacts of these higher costs.
•Supply Chain Volatility: Supply chain challenges, macroeconomic conditions and the impact of the COVID-19 pandemic on the manufacturing of our product disrupted the flow of seasonal product in fiscal 2022 and the first quarter of fiscal 2023, resulting in elevated inventory levels at the end of the first quarter of fiscal 2023. Throughout fiscal 2023, we took action to reduce excess inventory by decreasing future inventory purchases and increasing promotional activity. These actions, along with the stabilization of inventory transit times in the second and third quarters of fiscal 2023, resulted in the normalization of the seasonal flow of product in the fourth quarter of fiscal 2023.
2023 FORM 10-K 28
Table of Contents
•COVID-19 Impacts in Greater China: During the first and second quarters of fiscal 2023, we managed through continued temporary store closures and reduced retail traffic in Greater China, primarily due to COVID-19 related local government restrictions. At the beginning of the third quarter of fiscal 2023, the government mandated restrictions were lifted and we experienced improvement in physical retail traffic.
•Foreign Currency Impacts: As a global company with significant operations outside the United States, we are exposed to risk arising from foreign currency exchange rates. For fiscal 2023, fluctuations in foreign currency exchange rates negatively impacted our reported Revenues by approximately $2,859 million, reducing our revenue growth rate to 10% on a reported basis from 16% on a currency-neutral basis. Foreign currency impacts, net of hedges, also reduced our reported Income before income taxes by approximately $1,023 million. For further information, refer to “Foreign Currency Exposures and Hedging Practices”.
The operating environment could remain volatile in fiscal 2024 as the risk exists that worsening macroeconomic conditions could have a material adverse impact on our future revenue growth as well as overall profitability. For more information refer to Item 1A Risk Factors, within Part I, Item 1. Business.
RECENT DEVELOPMENTS
During the first and second quarters of fiscal 2023, we completed the sale of our entity in Chile and our entities in Argentina and Uruguay to third-party distributors, respectively. Now that we have completed the shift from a wholesale and direct to consumer operating model to a distributor model within our Central and South America (“CASA”) territory, we expect consolidated NIKE, Inc. and Asia Pacific & Latin America (“APLA”) revenue growth will be reduced due to different commercial terms. However, over time we expect the future operating model to have a favorable impact on our overall profitability as we reduce selling and administrative expenses, as well as reduce exposure to foreign exchange rate volatility.
USE OF NON-GAAP FINANCIAL MEASURES
Throughout this Annual Report on Form 10-K, we discuss non-GAAP financial measures, which should be considered in addition to, and not in lieu of, the financial measures calculated and presented in accordance with U.S. GAAP. References to these measures should not be considered in isolation or as a substitute for other financial measures calculated and presented in accordance with U.S. GAAP and may not be comparable to similarly titled measures used by other companies. Management uses these non-GAAP measures when evaluating the Company’s performance, including when making financial and operating decisions. Additionally, management believes these non-GAAP financial measures provide investors with additional financial information that should be considered when assessing our underlying business performance and trends.
Earnings Before Interest and Taxes (“EBIT”): Calculated as Net income before Interest expense (income), net and Income tax expense in the Consolidated Statements of Income. Total NIKE, Inc. EBIT for fiscal 2023 and fiscal 2022 is as follows:
| YEAR ENDED MAY 31, | ||||||||
| (Dollars in millions) | 2023 | 2022 | ||||||
| Net income | $ | 5,070 | $ | 6,046 | ||||
| Add: Interest expense (income), net | (6) | 205 | ||||||
| Add: Income tax expense | 1,131 | 605 | ||||||
| Earnings before interest and taxes | $ | 6,195 | $ | 6,856 | ||||
EBIT Margin: Calculated as total NIKE, Inc. EBIT divided by total NIKE, Inc. Revenues. Our EBIT Margin calculation for fiscal 2023 and fiscal 2022 is as follows:
| YEAR ENDED MAY 31, | ||||||||
| (Dollars in millions) | 2023 | 2022 | ||||||
| Numerator | ||||||||
| Earnings before interest and taxes | $ | 6,195 | $ | 6,856 | ||||
| Denominator | ||||||||
| Total NIKE, Inc. Revenues | $ | 51,217 | $ | 46,710 | ||||
| EBIT Margin | 12.1% | 14.7% | ||||||
2023 FORM 10-K 29
Table of Contents
Return on Invested Capital (“ROIC”): Represents a performance measure that management believes is useful information in understanding the Company’s ability to effectively manage invested capital. Our ROIC calculation as of May 31, 2023 and 2022 is as follows:
| FOR THE TRAILING FOUR QUARTERS ENDED | ||||||||
| (Dollars in millions) | MAY 31, 2023 | MAY 31, 2022 | ||||||
| Numerator | ||||||||
| Net income | $ | 5,070 | $ | 6,046 | ||||
| Add: Interest expense (income), net | (6) | 205 | ||||||
| Add: Income tax expense | 1,131 | 605 | ||||||
| Earnings before interest and taxes | 6,195 | 6,856 | ||||||
| Income tax adjustment(1) | (1,130) | (624) | ||||||
| Earnings before interest and after taxes | $ | 5,065 | $ | 6,232 | ||||
| AVERAGE FOR THE TRAILING FIVE QUARTERS ENDED | ||||||||
| MAY 31, 2023 | MAY 31, 2022 | |||||||
| Denominator | ||||||||
| Total debt(2) | $ | 12,491 | $ | 12,722 | ||||
| Add: Shareholders’ equity | 14,982 | 14,425 | ||||||
| Less: Cash and equivalents and Short-term investments | 11,394 | 13,748 | ||||||
| Total invested capital | $ | 16,079 | $ | 13,399 | ||||
| RETURN ON INVESTED CAPITAL | 31.5% | 46.5% | ||||||
(1)Equals Earnings before interest and taxes multiplied by the effective tax rate as of the respective quarter end.
(2)Total debt includes the following: 1) Current portion of long-term debt, 2) Notes Payable, 3) Current portion of operating lease liabilities, 4) Long-term debt and 5) Operating lease liabilities.
Currency-neutral revenues: Currency-neutral revenues enhance visibility to underlying business trends, excluding the impact of translation arising from foreign currency exchange rate fluctuations. Currency-neutral revenues are calculated using actual exchange rates in use during the comparative prior year period in place of the exchange rates in use during the current period.
Wholesale equivalent revenues: References to wholesale equivalent revenues are intended to provide context as to the total size of our NIKE Brand market footprint if we had no NIKE Direct operations. NIKE Brand wholesale equivalent revenues consist of (1) sales to external wholesale customers and (2) internal sales from our wholesale operations to our NIKE Direct operations, which are charged at prices comparable to those charged to external wholesale customers.
COMPARABLE STORE SALES
Comparable store sales: This key metric, which excludes NIKE Brand Digital sales, comprises revenues from NIKE-owned in-line and factory stores for which all three of the following requirements have been met: (1) the store has been open at least one year, (2) square footage has not changed by more than 15% within the past year and (3) the store has not been permanently repositioned within the past year. Comparable store sales includes revenues from stores that were temporarily closed during the period as a result of COVID-19. Comparable store sales represents a performance metric that we believe is useful information for management and investors in understanding the performance of our established NIKE-owned in-line and factory stores. Management considers this metric when making financial and operating decisions. The method of calculating comparable store sales varies across the retail industry. As a result, our calculation of this metric may not be comparable to similarly titled metrics used by other companies.
2023 FORM 10-K 30
Table of Contents
RESULTS OF OPERATIONS
| (Dollars in millions, except per share data) | FISCAL 2023 | FISCAL 2022 | % CHANGE | FISCAL 2021 | % CHANGE | ||||||||||||
| Revenues | $ | 51,217 | $ | 46,710 | 10 | % | $ | 44,538 | 5 | % | |||||||
| Cost of sales | 28,925 | 25,231 | 15 | % | 24,576 | 3 | % | ||||||||||
| Gross profit | 22,292 | 21,479 | 4 | % | 19,962 | 8 | % | ||||||||||
| Gross margin | 43.5 | % | 46.0 | % | 44.8 | % | |||||||||||
| Demand creation expense | 4,060 | 3,850 | 5 | % | 3,114 | 24 | % | ||||||||||
| Operating overhead expense | 12,317 | 10,954 | 12 | % | 9,911 | 11 | % | ||||||||||
| Total selling and administrative expense | 16,377 | 14,804 | 11 | % | 13,025 | 14 | % | ||||||||||
| % of revenues | 32.0 | % | 31.7 | % | 29.2 | % | |||||||||||
| Interest expense (income), net | (6) | 205 | — | 262 | — | ||||||||||||
| Other (income) expense, net | (280) | (181) | — | 14 | — | ||||||||||||
| Income before income taxes | 6,201 | 6,651 | -7 | % | 6,661 | 0 | % | ||||||||||
| Income tax expense | 1,131 | 605 | 87 | % | 934 | -35 | % | ||||||||||
| Effective tax rate | 18.2 | % | 9.1 | % | 14.0 | % | |||||||||||
| NET INCOME | $ | 5,070 | $ | 6,046 | -16 | % | $ | 5,727 | 6 | % | |||||||
| Diluted earnings per common share | $ | 3.23 | $ | 3.75 | -14 | % | $ | 3.56 | 5 | % | |||||||
2023 FORM 10-K 31
Table of Contents
CONSOLIDATED OPERATING RESULTS
REVENUES
| (Dollars in millions) | FISCAL 2023 | FISCAL 2022 | % CHANGE | % CHANGE EXCLUDING CURRENCY CHANGES(1) | FISCAL 2021 | % CHANGE | % CHANGE EXCLUDING CURRENCY CHANGES(1) | ||||||||||||||||
| NIKE, Inc. Revenues: | |||||||||||||||||||||||
| NIKE Brand Revenues by: | |||||||||||||||||||||||
| Footwear | $ | 33,135 | $ | 29,143 | 14 | % | 20 | % | $ | 28,021 | 4 | % | 4 | % | |||||||||
| Apparel | 13,843 | 13,567 | 2 | % | 8 | % | 12,865 | 5 | % | 6 | % | ||||||||||||
| Equipment | 1,727 | 1,624 | 6 | % | 13 | % | 1,382 | 18 | % | 18 | % | ||||||||||||
| Global Brand Divisions(2) | 58 | 102 | -43 | % | -43 | % | 25 | 308 | % | 302 | % | ||||||||||||
| Total NIKE Brand Revenues | $ | 48,763 | $ | 44,436 | 10 | % | 16 | % | $ | 42,293 | 5 | % | 6 | % | |||||||||
| Converse | 2,427 | 2,346 | 3 | % | 8 | % | 2,205 | 6 | % | 7 | % | ||||||||||||
| Corporate(3) | 27 | (72) | — | — | 40 | — | — | ||||||||||||||||
| TOTAL NIKE, INC. REVENUES | $ | 51,217 | $ | 46,710 | 10 | % | 16 | % | $ | 44,538 | 5 | % | 6 | % | |||||||||
| Supplemental NIKE Brand Revenues Details: | |||||||||||||||||||||||
| NIKE Brand Revenues by: | |||||||||||||||||||||||
| Sales to Wholesale Customers | $ | 27,397 | $ | 25,608 | 7 | % | 14 | % | $ | 25,898 | -1 | % | -1 | % | |||||||||
| Sales through NIKE Direct | 21,308 | 18,726 | 14 | % | 20 | % | 16,370 | 14 | % | 15 | % | ||||||||||||
| Global Brand Divisions(2) | 58 | 102 | -43 | % | -43 | % | 25 | 308 | % | 302 | % | ||||||||||||
| TOTAL NIKE BRAND REVENUES | $ | 48,763 | $ | 44,436 | 10 | % | 16 | % | $ | 42,293 | 5 | % | 6 | % | |||||||||
| NIKE Brand Revenues on a Wholesale Equivalent Basis(1): | |||||||||||||||||||||||
| Sales to Wholesale Customers | $ | 27,397 | $ | 25,608 | 7 | % | 14 | % | $ | 25,898 | -1 | % | -1 | % | |||||||||
| Sales from our Wholesale Operations to NIKE Direct Operations | 12,730 | 10,543 | 21 | % | 27 | % | 9,872 | 7 | % | 7 | % | ||||||||||||
| TOTAL NIKE BRAND WHOLESALE EQUIVALENT REVENUES | $ | 40,127 | $ | 36,151 | 11 | % | 18 | % | $ | 35,770 | 1 | % | 1 | % | |||||||||
| NIKE Brand Wholesale Equivalent Revenues by:(1),(4) | |||||||||||||||||||||||
| Men’s | $ | 20,733 | $ | 18,797 | 10 | % | 17 | % | $ | 18,391 | 2 | % | 3 | % | |||||||||
| Women’s | 8,606 | 8,273 | 4 | % | 11 | % | 8,225 | 1 | % | 1 | % | ||||||||||||
| NIKE Kids’ | 5,038 | 4,874 | 3 | % | 10 | % | 4,882 | 0 | % | 0 | % | ||||||||||||
| Jordan Brand | 6,589 | 5,122 | 29 | % | 35 | % | 4,780 | 7 | % | 7 | % | ||||||||||||
| Others(5) | (839) | (915) | 8 | % | -3 | % | (508) | -80 | % | -79 | % | ||||||||||||
| TOTAL NIKE BRAND WHOLESALE EQUIVALENT REVENUES | $ | 40,127 | $ | 36,151 | 11 | % | 18 | % | $ | 35,770 | 1 | % | 1 | % | |||||||||
(1)The percent change excluding currency changes and the presentation of wholesale equivalent revenues represent non-GAAP financial measures. For further information, see “Use of Non-GAAP Financial Measures”.
(2)Global Brand Divisions revenues include NIKE Brand licensing and other miscellaneous revenues that are not part of a geographic operating segment.
(3)Corporate revenues primarily consist of foreign currency hedge gains and losses related to revenues generated by entities within the NIKE Brand geographic operating segments and Converse, but managed through our central foreign exchange risk management program.
(4)As a result of the Consumer Direct Acceleration strategy, announced in fiscal 2021, the Company is now organized around a consumer construct of Men’s, Women’s and Kids’. Beginning in the first quarter of fiscal 2022, unisex products are classified within Men’s, and Jordan Brand revenues are separately reported. Certain prior year amounts were reclassified to conform to fiscal 2022 presentation. These changes had no impact on previously reported consolidated results of operations or shareholders’ equity.
(5)Others include products not allocated to Men’s, Women’s, NIKE Kids’ and Jordan Brand, as well as certain adjustments that are not allocated to products designated by consumer.
2023 FORM 10-K 32
Table of Contents
FISCAL 2023 NIKE BRAND REVENUE HIGHLIGHTS
The following tables present NIKE Brand revenues disaggregated by reportable operating segment, distribution channel and major product line:
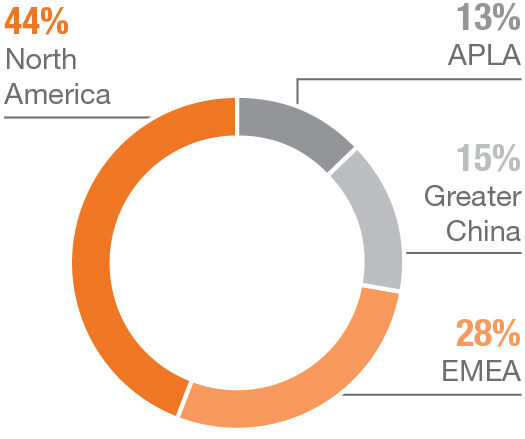 | 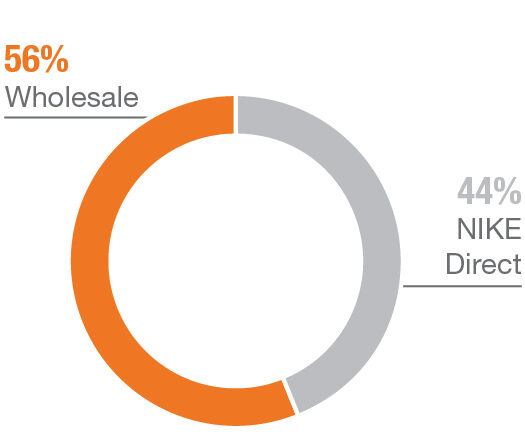 | 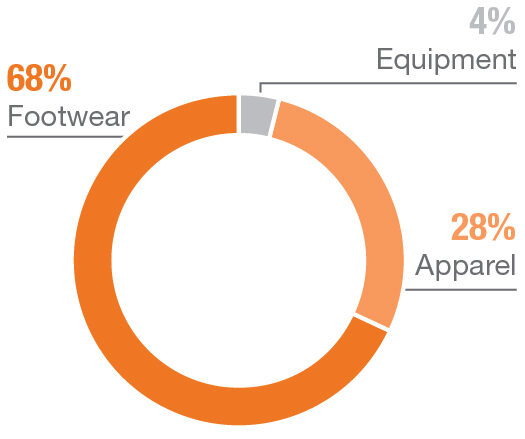 | ||||||
FISCAL 2023 COMPARED TO FISCAL 2022
•NIKE, Inc. Revenues were $51.2 billion in fiscal 2023, which increased 10% and 16% compared to fiscal 2022 on a reported and currency-neutral basis, respectively. The increase was due to higher revenues in North America, Europe, Middle East & Africa (“EMEA”), APLA and Greater China, which contributed approximately 7, 6, 2 and 1 percentage points to NIKE, Inc. Revenues, respectively.
•NIKE Brand revenues, which represented over 90% of NIKE, Inc. Revenues, increased 10% and 16% on a reported and currency-neutral basis, respectively. This increase was primarily due to higher revenues in Men’s, the Jordan Brand, Women’s and Kids’ which grew 17%, 35%,11% and 10%, respectively, on a wholesale equivalent basis.
•NIKE Brand footwear revenues increased 20% on a currency-neutral basis, due to higher revenues in Men’s, the Jordan Brand, Women’s and Kids’. Unit sales of footwear increased 13%, while higher average selling price (“ASP”) per pair contributed approximately 7 percentage points of footwear revenue growth. Higher ASP was primarily due to higher full-price ASP, net of discounts, on a wholesale equivalent basis, and growth in the size of our NIKE Direct business, partially offset by lower NIKE Direct ASP.
•NIKE Brand apparel revenues increased 8% on a currency-neutral basis, primarily due to higher revenues in Men’s. Unit sales of apparel increased 4%, while higher ASP per unit contributed approximately 4 percentage points of apparel revenue growth. Higher ASP was primarily due to higher full-price ASP and growth in the size of our NIKE Direct business, partially offset by lower NIKE Direct ASP, reflecting higher promotional activity.
•NIKE Direct revenues increased 14% from $18.7 billion in fiscal 2022 to $21.3 billion in fiscal 2023. On a currency-neutral basis, NIKE Direct revenues increased 20% primarily driven by NIKE Brand Digital sales growth of 24%, comparable store sales growth of 14% and the addition of new stores. For further information regarding comparable store sales, including the definition, see “Comparable Store Sales”. NIKE Brand Digital sales were $12.6 billion for fiscal 2023 compared to $10.7 billion for fiscal 2022.
2023 FORM 10-K 33
Table of Contents
GROSS MARGIN
FISCAL 2023 COMPARED TO FISCAL 2022
For fiscal 2023, our consolidated gross profit increased 4% to $22,292 million compared to $21,479 million for fiscal 2022. Gross margin decreased 250 basis points to 43.5% for fiscal 2023 compared to 46.0% for fiscal 2022 due to the following:
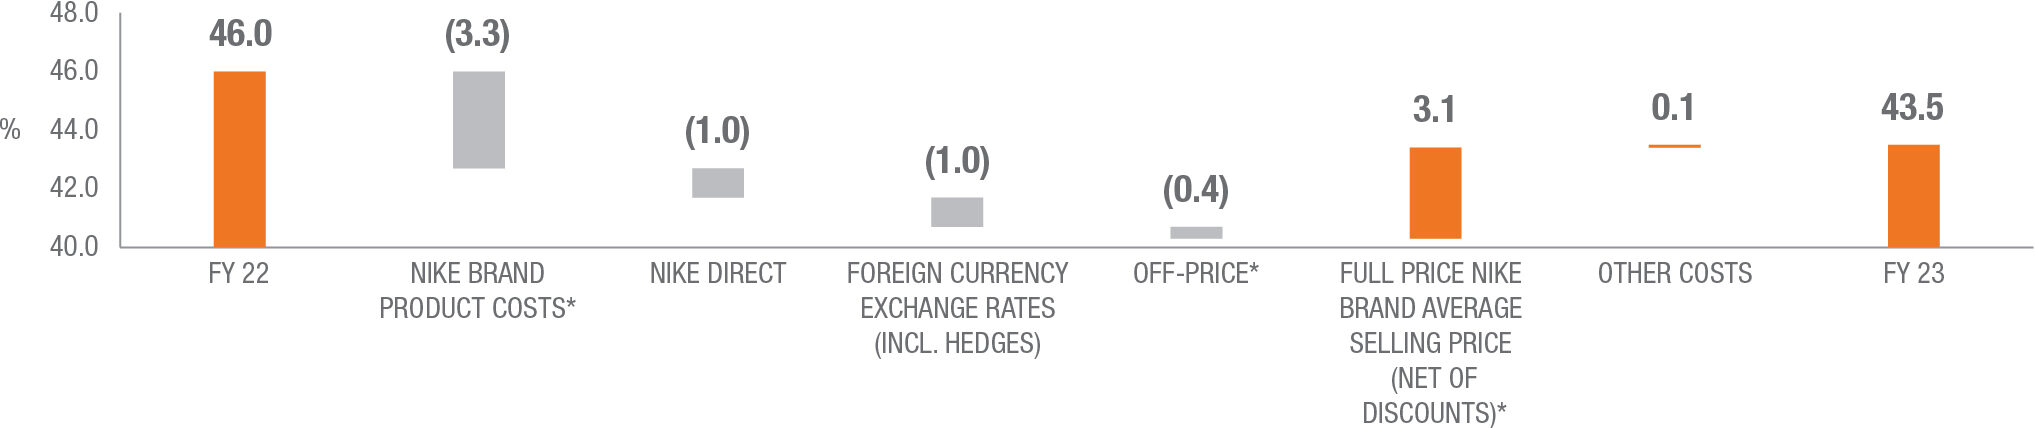 | ||
| *Wholesale equivalent | ||
The decrease in gross margin for fiscal 2023 was primarily due to:
•Higher NIKE Brand product costs, on a wholesale equivalent basis, primarily due to higher input costs and elevated inbound freight and logistics costs as well as product mix;
•Lower margin in our NIKE Direct business, driven by higher promotional activity to liquidate inventory in the current period compared to lower promotional activity in the prior period resulting from lower available inventory supply;
•Unfavorable changes in net foreign currency exchange rates, including hedges; and
•Lower off-price margin, on a wholesale equivalent basis.
This was partially offset by:
•Higher NIKE Brand full-price ASP, net of discounts, on a wholesale equivalent basis, due primarily to strategic pricing actions and product mix; and
•Lower other costs, primarily due to higher inventory obsolescence reserves recognized in Greater China in the fourth quarter of fiscal 2022.
TOTAL SELLING AND ADMINISTRATIVE EXPENSE
| (Dollars in millions) | FISCAL 2023 | FISCAL 2022 | % CHANGE | FISCAL 2021 | % CHANGE | ||||||||||||
| Demand creation expense(1) | $ | 4,060 | $ | 3,850 | 5 | % | $ | 3,114 | 24 | % | |||||||
| Operating overhead expense | 12,317 | 10,954 | 12 | % | 9,911 | 11 | % | ||||||||||
| Total selling and administrative expense | $ | 16,377 | $ | 14,804 | 11 | % | $ | 13,025 | 14 | % | |||||||
| % of revenues | 32.0 | % | 31.7 | % | 30 | bps | 29.2 | % | 250 | bps | |||||||
(1)Demand creation expense consists of advertising and promotion costs, including costs of endorsement contracts, complimentary product, television, digital and print advertising and media costs, brand events and retail brand presentation.
FISCAL 2023 COMPARED TO FISCAL 2022
Demand creation expense increased 5% for fiscal 2023, primarily due to higher advertising and marketing expense and higher sports marketing expense. Changes in foreign currency exchange rates decreased Demand creation expense by approximately 4 percentage points.
Operating overhead expense increased 12%, primarily due to higher wage-related expenses, NIKE Direct variable costs, strategic technology enterprise investments and other administrative costs. Changes in foreign currency exchange rates decreased Operating overhead expense by approximately 3 percentage points.
2023 FORM 10-K 34
Table of Contents
OTHER (INCOME) EXPENSE, NET
| (Dollars in millions) | FISCAL 2023 | FISCAL 2022 | FISCAL 2021 | |||||||||||||||||
| Other (income) expense, net | $ | (280) | $ | (181) | $ | 14 | ||||||||||||||
Other (income) expense, net comprises foreign currency conversion gains and losses from the remeasurement of monetary assets and liabilities denominated in non-functional currencies and the impact of certain foreign currency derivative instruments, as well as unusual or non-operating transactions that are outside the normal course of business.
FISCAL 2023 COMPARED TO FISCAL 2022
Other (income) expense, net increased from $181 million of other income, net in fiscal 2022 to $280 million in the current fiscal year, primarily due to a net favorable change in foreign currency conversion gains and losses, including hedges, and the one-time charge related to the deconsolidation of our Russian operations recognized in the prior year. This increase was partially offset by net unfavorable activity related to our strategic distributor partnership transition within APLA, including the loss recognized upon the completion of the sale of our entities in Argentina and Uruguay to a third-party distributor in the second quarter of fiscal 2023.
For more information related to our distributor partnership transition within APLA, see Note 18 — Acquisitions and Divestitures within the accompanying Notes to the Consolidated Financial Statements.
We estimate the combination of the translation of foreign currency-denominated profits from our international businesses, and the year-over-year change in foreign currency-related gains and losses included in Other (income) expense, net had an unfavorable impact on our Income before income taxes of $1,023 million for fiscal 2023.
INCOME TAXES
| FISCAL 2023 | FISCAL 2022 | % CHANGE | FISCAL 2021 | % CHANGE | |||||||||||||
| Effective tax rate | 18.2 | % | 9.1 | % | 910 bps | 14.0 | % | (490) bps | |||||||||
FISCAL 2023 COMPARED TO FISCAL 2022
Our effective tax rate was 18.2% for fiscal 2023, compared to 9.1% for fiscal 2022, primarily due to decreased benefits from stock-based compensation and a non-cash, one-time benefit in the prior year related to the onshoring of certain non-U.S. intangible property ownership rights.
On August 16, 2022, the U.S. government enacted the Inflation Reduction Act of 2022 that includes, among other provisions, changes to the U.S. corporate income tax system, including a fifteen percent minimum tax based on “adjusted financial statement income,” which is effective for NIKE beginning June 1, 2023. Based on our current analysis of the provisions, we do not expect these tax law changes to have a material impact on our financial statements; however, we will continue to evaluate their impact as further information becomes available.
2023 FORM 10-K 35
Table of Contents
OPERATING SEGMENTS
As discussed in Note 15 — Operating Segments and Related Information in the accompanying Notes to the Consolidated Financial Statements, our operating segments are evidence of the structure of the Company’s internal organization. The NIKE Brand segments are defined by geographic regions for operations participating in NIKE Brand sales activity.
The breakdown of Revenues is as follows:
| (Dollars in millions) | FISCAL 2023 | FISCAL 2022 | % CHANGE | % CHANGE EXCLUDING CURRENCY CHANGES(1) | FISCAL 2021 | % CHANGE | % CHANGE EXCLUDING CURRENCY CHANGES(1) | ||||||||||||||||
| North America | $ | 21,608 | $ | 18,353 | 18 | % | 18 | % | $ | 17,179 | 7 | % | 7 | % | |||||||||
| Europe, Middle East & Africa | 13,418 | 12,479 | 8 | % | 21 | % | 11,456 | 9 | % | 12 | % | ||||||||||||
| Greater China | 7,248 | 7,547 | -4 | % | 4 | % | 8,290 | -9 | % | -13 | % | ||||||||||||
| Asia Pacific & Latin America(2) | 6,431 | 5,955 | 8 | % | 17 | % | 5,343 | 11 | % | 16 | % | ||||||||||||
| Global Brand Divisions(3) | 58 | 102 | -43 | % | -43 | % | 25 | 308 | % | 302 | % | ||||||||||||
| TOTAL NIKE BRAND | $ | 48,763 | $ | 44,436 | 10 | % | 16 | % | $ | 42,293 | 5 | % | 6 | % | |||||||||
| Converse | 2,427 | 2,346 | 3 | % | 8 | % | 2,205 | 6 | % | 7 | % | ||||||||||||
| Corporate(4) | 27 | (72) | — | — | 40 | — | — | ||||||||||||||||
| TOTAL NIKE, INC. REVENUES | $ | 51,217 | $ | 46,710 | 10 | % | 16 | % | $ | 44,538 | 5 | % | 6 | % | |||||||||
(1) The percent change excluding currency changes represents a non-GAAP financial measure. For further information, see “Use of Non-GAAP Financial Measures”.
(2) For additional information on the transition of our NIKE Brand businesses within our CASA territory to a third-party distributor, see Note 18 — Acquisitions and Divestitures of the Notes to Consolidated Financial Statements contained in Item 8 of this Annual Report.
(3) Global Brand Divisions revenues include NIKE Brand licensing and other miscellaneous revenues that are not part of a geographic operating segment.
(4) Corporate revenues primarily consist of foreign currency hedge gains and losses related to revenues generated by entities within the NIKE Brand geographic operating segments and Converse, but managed through our central foreign exchange risk management program.
The primary financial measure used by the Company to evaluate performance is Earnings Before Interest and Taxes (“EBIT”). As discussed in Note 15 — Operating Segments and Related Information in the accompanying Notes to the Consolidated Financial Statements, certain corporate costs are not included in EBIT.
The breakdown of EBIT is as follows:
| (Dollars in millions) | FISCAL 2023 | FISCAL 2022 | % CHANGE | FISCAL 2021 | % CHANGE | ||||||||||||||||||||||||
| North America | $ | 5,454 | $ | 5,114 | 7 | % | $ | 5,089 | 0 | % | |||||||||||||||||||
| Europe, Middle East & Africa | 3,531 | 3,293 | 7 | % | 2,435 | 35 | % | ||||||||||||||||||||||
| Greater China | 2,283 | 2,365 | -3 | % | 3,243 | -27 | % | ||||||||||||||||||||||
| Asia Pacific & Latin America | 1,932 | 1,896 | 2 | % | 1,530 | 24 | % | ||||||||||||||||||||||
| Global Brand Divisions | (4,841) | (4,262) | -14 | % | (3,656) | -17 | % | ||||||||||||||||||||||
| TOTAL NIKE BRAND(1) | $ | 8,359 | $ | 8,406 | -1 | % | $ | 8,641 | -3 | % | |||||||||||||||||||
| Converse | 676 | 669 | 1 | % | 543 | 23 | % | ||||||||||||||||||||||
| Corporate | (2,840) | (2,219) | -28 | % | (2,261) | 2 | % | ||||||||||||||||||||||
| TOTAL NIKE, INC. EARNINGS BEFORE INTEREST AND TAXES(1) | $ | 6,195 | $ | 6,856 | -10 | % | $ | 6,923 | -1 | % | |||||||||||||||||||
| EBIT margin(1) | 12.1 | % | 14.7 | % | 15.5 | % | |||||||||||||||||||||||
| Interest expense (income), net | (6) | 205 | — | 262 | — | ||||||||||||||||||||||||
| TOTAL NIKE, INC. INCOME BEFORE INCOME TAXES | $ | 6,201 | $ | 6,651 | -7 | % | $ | 6,661 | 0 | % | |||||||||||||||||||
(1) Total NIKE Brand EBIT, Total NIKE, Inc. EBIT and EBIT Margin represent non-GAAP financial measures. See “Use of Non-GAAP Financial Measures” for further information.
2023 FORM 10-K 36
Table of Contents
NORTH AMERICA
| (Dollars in millions) | FISCAL 2023 | FISCAL 2022 | % CHANGE | % CHANGE EXCLUDING CURRENCY CHANGES | FISCAL 2021 | % CHANGE | % CHANGE EXCLUDING CURRENCY CHANGES | ||||||||||||||||
| Revenues by: | |||||||||||||||||||||||
| Footwear | $ | 14,897 | $ | 12,228 | 22 | % | 22 | % | $ | 11,644 | 5 | % | 5 | % | |||||||||
| Apparel | 5,947 | 5,492 | 8 | % | 9 | % | 5,028 | 9 | % | 9 | % | ||||||||||||
| Equipment | 764 | 633 | 21 | % | 21 | % | 507 | 25 | % | 25 | % | ||||||||||||
| TOTAL REVENUES | $ | 21,608 | $ | 18,353 | 18 | % | 18 | % | $ | 17,179 | 7 | % | 7 | % | |||||||||
| Revenues by: | |||||||||||||||||||||||
| Sales to Wholesale Customers | $ | 11,273 | $ | 9,621 | 17 | % | 18 | % | $ | 10,186 | -6 | % | -6 | % | |||||||||
| Sales through NIKE Direct | 10,335 | 8,732 | 18 | % | 18 | % | 6,993 | 25 | % | 25 | % | ||||||||||||
| TOTAL REVENUES | $ | 21,608 | $ | 18,353 | 18 | % | 18 | % | $ | 17,179 | 7 | % | 7 | % | |||||||||
| EARNINGS BEFORE INTEREST AND TAXES | $ | 5,454 | $ | 5,114 | 7 | % | $ | 5,089 | 0 | % | |||||||||||||
FISCAL 2023 COMPARED TO FISCAL 2022
•North America revenues increased 18% on a currency-neutral basis, primarily due to higher revenues in Men’s and the Jordan Brand. NIKE Direct revenues increased 18%, driven by strong digital sales growth of 23%, comparable store sales growth of 9% and the addition of new stores.
•Footwear revenues increased 22% on a currency-neutral basis, primarily due to higher revenues in Men’s and the Jordan Brand. Unit sales of footwear increased 17%, while higher ASP per pair contributed approximately 5 percentage points of footwear revenue growth. Higher ASP per pair was primarily due to higher full-price ASP and growth in NIKE Direct, partially offset by lower NIKE Direct ASP, reflecting higher promotional activity as well as lower available inventory supply in the prior period and a lower mix of full-price sales.
•Apparel revenues increased 9% on a currency-neutral basis, primarily due to higher revenues in Men’s. Unit sales of apparel increased 7%, while higher ASP per unit contributed approximately 2 percentage points of apparel revenue growth. Higher ASP per unit was primarily due to higher full-price ASP and growth in NIKE Direct, partially offset by lower NIKE Direct ASP, reflecting higher promotional activity.
Reported EBIT increased 7% due to higher revenues and the following:
•Gross margin contraction of 310 basis points primarily due to higher product costs, reflecting higher input costs and inbound freight and logistics costs and product mix, lower margins in NIKE Direct due to higher promotional activity and a lower mix of full-price sales. This was partially offset by higher full-price ASP, net of discounts, largely due to strategic pricing actions and product mix.
•Selling and administrative expense increased 15% due to higher operating overhead and demand creation expense. The increase in operating overhead expense was primarily due to higher wage-related costs and higher NIKE Direct variable costs, in part due to new store additions. Demand creation expense increased primarily due to higher sports marketing expense and an increase in digital marketing.
2023 FORM 10-K 37
Table of Contents
EUROPE, MIDDLE EAST & AFRICA
| (Dollars in millions) | FISCAL 2023 | FISCAL 2022 | % CHANGE | % CHANGE EXCLUDING CURRENCY CHANGES | FISCAL 2021 | % CHANGE | % CHANGE EXCLUDING CURRENCY CHANGES | ||||||||||||||||
| Revenues by: | |||||||||||||||||||||||
| Footwear | $ | 8,260 | $ | 7,388 | 12 | % | 25 | % | $ | 6,970 | 6 | % | 9 | % | |||||||||
| Apparel | 4,566 | 4,527 | 1 | % | 14 | % | 3,996 | 13 | % | 16 | % | ||||||||||||
| Equipment | 592 | 564 | 5 | % | 18 | % | 490 | 15 | % | 17 | % | ||||||||||||
| TOTAL REVENUES | $ | 13,418 | $ | 12,479 | 8 | % | 21 | % | $ | 11,456 | 9 | % | 12 | % | |||||||||
| Revenues by: | |||||||||||||||||||||||
| Sales to Wholesale Customers | $ | 8,522 | $ | 8,377 | 2 | % | 15 | % | $ | 7,812 | 7 | % | 10 | % | |||||||||
| Sales through NIKE Direct | 4,896 | 4,102 | 19 | % | 33 | % | 3,644 | 13 | % | 15 | % | ||||||||||||
| TOTAL REVENUES | $ | 13,418 | $ | 12,479 | 8 | % | 21 | % | $ | 11,456 | 9 | % | 12 | % | |||||||||
| EARNINGS BEFORE INTEREST AND TAXES | $ | 3,531 | $ | 3,293 | 7 | % | $ | 2,435 | 35 | % | |||||||||||||
FISCAL 2023 COMPARED TO FISCAL 2022
•EMEA revenues increased 21% on a currency-neutral basis, due to higher revenues in Men’s, the Jordan Brand, Women’s and Kids’. NIKE Direct revenues increased 33%, driven primarily by strong digital sales growth of 43% and comparable store sales growth of 22%.
•Footwear revenues increased 25% on a currency-neutral basis, due to higher revenues in Men’s, the Jordan Brand, Women’s and Kids’. Unit sales of footwear increased 9%, while higher ASP per pair contributed approximately 16 percentage points of footwear revenue growth. Higher ASP per pair was primarily due to higher full-price ASP and growth in NIKE Direct.
•Apparel revenues increased 14% on a currency-neutral basis, primarily due to higher revenues in Men’s. Unit sales of apparel increased 2%, while higher ASP per unit contributed approximately 12 percentage points of apparel revenue growth. Higher ASP per unit was primarily due to higher full-price ASP and growth in NIKE Direct, partially offset by lower NIKE Direct ASP, reflecting higher promotional activity.
Reported EBIT increased 7% due to higher revenues and the following:
•Gross margin contraction of 60 basis points primarily due to higher product costs reflecting higher input costs, inbound freight and logistics costs and product mix, higher other costs and unfavorable changes in standard foreign currency exchange rates. This was partially offset by higher full-price ASP, net of discounts, primarily due to strategic pricing actions and product mix.
•Selling and administrative expense increased 4% due to higher operating overhead and demand creation expense. Operating overhead expense increased primarily due to higher wage-related expenses and other administrative costs, partially offset by favorable changes in foreign currency exchange rates. Demand creation expense increased primarily due to higher advertising and marketing expense, partially offset by favorable changes in foreign currency exchange rates.
2023 FORM 10-K 38
Table of Contents
GREATER CHINA
| (Dollars in millions) | FISCAL 2023 | FISCAL 2022 | % CHANGE | % CHANGE EXCLUDING CURRENCY CHANGES | FISCAL 2021 | % CHANGE | % CHANGE EXCLUDING CURRENCY CHANGES | ||||||||||||||||
| Revenues by: | |||||||||||||||||||||||
| Footwear | $ | 5,435 | $ | 5,416 | 0 | % | 8 | % | $ | 5,748 | -6 | % | -10 | % | |||||||||
| Apparel | 1,666 | 1,938 | -14 | % | -7 | % | 2,347 | -17 | % | -21 | % | ||||||||||||
| Equipment | 147 | 193 | -24 | % | -18 | % | 195 | -1 | % | -6 | % | ||||||||||||
| TOTAL REVENUES | $ | 7,248 | $ | 7,547 | -4 | % | 4 | % | $ | 8,290 | -9 | % | -13 | % | |||||||||
| Revenues by: | |||||||||||||||||||||||
| Sales to Wholesale Customers | $ | 3,866 | $ | 4,081 | -5 | % | 2 | % | $ | 4,513 | -10 | % | -14 | % | |||||||||
| Sales through NIKE Direct | 3,382 | 3,466 | -2 | % | 5 | % | 3,777 | -8 | % | -12 | % | ||||||||||||
| TOTAL REVENUES | $ | 7,248 | $ | 7,547 | -4 | % | 4 | % | $ | 8,290 | -9 | % | -13 | % | |||||||||
| EARNINGS BEFORE INTEREST AND TAXES | $ | 2,283 | $ | 2,365 | -3 | % | $ | 3,243 | -27 | % | |||||||||||||
FISCAL 2023 COMPARED TO FISCAL 2022
•Greater China revenues increased 4% on a currency-neutral basis, primarily due to higher revenues in the Jordan Brand, partially offset by lower revenues in Men’s and Women’s. NIKE Direct revenues increased 5%, due to comparable store sales growth of 9% and the addition of new stores, partially offset by digital sales declines of 4%.
•Footwear revenues increased 8% on a currency-neutral basis, primarily due to higher revenues in the Jordan Brand and Men’s. Unit sales of footwear increased 7%, while higher ASP per pair contributed approximately 1 percentage point of footwear revenue growth. Higher ASP per pair was primarily due to higher NIKE Direct ASP and a higher mix of full-price sales, largely offset by a lower mix of NIKE Direct sales.
•Apparel revenues decreased 7% on a currency-neutral basis, primarily due to lower revenues in Men’s and Women’s. Unit sales of apparel decreased 8%, while higher ASP per unit contributed approximately 1 percentage point of apparel revenue growth. Higher ASP per unit was primarily due to a higher mix of full price sales, partially offset by lower off-price ASP.
Reported EBIT decreased 3% due to lower revenues and the following:
•Gross margin expansion of approximately 140 basis points, primarily due to higher inventory obsolescence reserves recognized in the fourth quarter of fiscal 2022, favorable changes in standard foreign currency exchange rates and higher full-price ASP, net of discounts, in part due to product mix. This was partially offset by higher product costs reflecting higher input costs and product mix.
•Selling and administrative expense was flat due to increased operating overhead expense offset by lower demand creation expense. The increase in operating overhead expense was primarily due to higher wage-related expenses and other administrative costs, partially offset by favorable changes in foreign currency exchange rates. Demand creation expense decreased primarily due to lower retail brand presentation costs, lower digital marketing and favorable changes in foreign currency exchange rates, partially offset by higher advertising and marketing expense.
2023 FORM 10-K 39
Table of Contents
ASIA PACIFIC & LATIN AMERICA
| (Dollars in millions) | FISCAL 2023 | FISCAL 2022 | % CHANGE | % CHANGE EXCLUDING CURRENCY CHANGES | FISCAL 2021 | % CHANGE | % CHANGE EXCLUDING CURRENCY CHANGES | ||||||||||||||||
| Revenues by: | |||||||||||||||||||||||
| Footwear | $ | 4,543 | $ | 4,111 | 11 | % | 19 | % | $ | 3,659 | 12 | % | 17 | % | |||||||||
| Apparel | 1,664 | 1,610 | 3 | % | 13 | % | 1,494 | 8 | % | 12 | % | ||||||||||||
| Equipment | 224 | 234 | -4 | % | 4 | % | 190 | 23 | % | 28 | % | ||||||||||||
| TOTAL REVENUES | $ | 6,431 | $ | 5,955 | 8 | % | 17 | % | $ | 5,343 | 11 | % | 16 | % | |||||||||
| Revenues by: | |||||||||||||||||||||||
| Sales to Wholesale Customers | $ | 3,736 | $ | 3,529 | 6 | % | 14 | % | $ | 3,387 | 4 | % | 8 | % | |||||||||
| Sales through NIKE Direct | 2,695 | 2,426 | 11 | % | 22 | % | 1,956 | 24 | % | 30 | % | ||||||||||||
| TOTAL REVENUES | $ | 6,431 | $ | 5,955 | 8 | % | 17 | % | $ | 5,343 | 11 | % | 16 | % | |||||||||
| EARNINGS BEFORE INTEREST AND TAXES | $ | 1,932 | $ | 1,896 | 2 | % | $ | 1,530 | 24 | % | |||||||||||||
As discussed previously, our NIKE Brand business in Brazil transitioned to a distributor operating model during fiscal 2021. We completed the sale of our entity in Chile and our entities in Argentina and Uruguay to third-party distributors in the first and second quarters of fiscal 2023, respectively. The impacts of closing these transactions are included within Corporate and are not reflected in the APLA operating segment results. This completed the transition of our NIKE Brand businesses within our CASA marketplace, which now reflects a full distributor operating model. For more information see Note 18 — Acquisitions and Divestitures within the accompanying Notes to the Consolidated Financial Statements.
FISCAL 2023 COMPARED TO FISCAL 2022
•APLA revenues increased 17% on a currency-neutral basis due to higher revenues across nearly all territories, led by Southeast Asia and India, Korea and Japan. The increase was partially offset by a decline in our CASA territory. Within our CASA territory, the transition of our Chile, Argentina and Uruguay entities to a third-party distributor operating model reduced APLA revenue growth by approximately 5 percentage points. Revenues increased primarily due to growth in Men’s, Women’s and the Jordan Brand. NIKE Direct revenues increased 22%, driven by digital sales growth of 23% and comparable store sales growth of 28%.
•Footwear revenues increased 19% on a currency-neutral basis, primarily due to higher revenues in Men’s, Women’s and the Jordan Brand. Unit sales of footwear increased 16%, while higher ASP per pair contributed approximately 3 percentage points of footwear revenue growth. Higher ASP per pair was primarily due to higher full-price ASP and growth in NIKE Direct, partially offset by lower NIKE Direct ASP.
•Apparel revenues increased 13% on a currency-neutral basis, primarily due to higher revenues in Men’s. Unit sales of apparel increased 9%, while higher ASP per unit contributed approximately 4 percentage points of apparel revenue growth. Higher ASP per unit was primarily due to higher full-price and off-price ASPs, partially offset by lower NIKE Direct ASP.
Reported EBIT increased 2% due to higher revenues and the following:
•Gross margin contraction of approximately 190 basis points primarily due to higher product costs, reflecting product mix and higher input costs, as well as unfavorable changes in standard foreign currency exchange rates. This was partially offset by higher full-price ASP, net of discounts, due to product mix and strategic pricing actions.
•Selling and administrative expense increased 8% due to higher operating overhead and demand creation expense. Operating overhead expense increased primarily due to higher wage-related expenses and an increase in NIKE Direct variable costs, partially offset by favorable changes in foreign currency exchange rates. Demand creation expense increased primarily due to higher sports marketing expense and higher advertising and marketing expense, partially offset by favorable changes in foreign currency exchange rates.
2023 FORM 10-K 40
Table of Contents
GLOBAL BRAND DIVISIONS
| (Dollars in millions) | FISCAL 2023 | FISCAL 2022 | % CHANGE | % CHANGE EXCLUDING CURRENCY CHANGES | FISCAL 2021 | % CHANGE | % CHANGE EXCLUDING CURRENCY CHANGES | ||||||||||||||||
| Revenues | $ | 58 | $ | 102 | -43 | % | -43 | % | $ | 25 | 308 | % | 302 | % | |||||||||
| Earnings (Loss) Before Interest and Taxes | $ | (4,841) | $ | (4,262) | -14 | % | $ | (3,656) | -17 | % | |||||||||||||
Global Brand Divisions primarily represent demand creation and operating overhead expense, including product creation and design expenses that are centrally managed for the NIKE Brand, as well as costs associated with NIKE Direct global digital operations and enterprise technology. Global Brand Divisions revenues include NIKE Brand licensing and other miscellaneous revenues that are not part of a geographic operating segment.
FISCAL 2023 COMPARED TO FISCAL 2022
Global Brand Divisions’ loss before interest and taxes increased 14% for fiscal 2023 primarily due to a 12% increase in selling and administrative expense from higher operating overhead expense largely driven by higher wage-related costs and strategic technology enterprise investments.
CONVERSE
| (Dollars in millions) | FISCAL 2023 | FISCAL 2022 | % CHANGE | % CHANGE EXCLUDING CURRENCY CHANGES | FISCAL 2021 | % CHANGE | % CHANGE EXCLUDING CURRENCY CHANGES | ||||||||||||||||
| Revenues by: | |||||||||||||||||||||||
| Footwear | $ | 2,155 | $ | 2,094 | 3 | % | 8 | % | $ | 1,986 | 5 | % | 6 | % | |||||||||
| Apparel | 90 | 103 | -13 | % | -7 | % | 104 | -1 | % | -3 | % | ||||||||||||
| Equipment | 28 | 26 | 8 | % | 16 | % | 29 | -10 | % | -16 | % | ||||||||||||
| Other(1) | 154 | 123 | 25 | % | 25 | % | 86 | 43 | % | 42 | % | ||||||||||||
| TOTAL REVENUES | $ | 2,427 | $ | 2,346 | 3 | % | 8 | % | $ | 2,205 | 6 | % | 7 | % | |||||||||
| Revenues by: | |||||||||||||||||||||||
| Sales to Wholesale Customers | $ | 1,299 | $ | 1,292 | 1 | % | 7 | % | $ | 1,353 | -5 | % | -4 | % | |||||||||
| Sales through Direct to Consumer | 974 | 931 | 5 | % | 8 | % | 766 | 22 | % | 22 | % | ||||||||||||
| Other(1) | 154 | 123 | 25 | % | 25 | % | 86 | 43 | % | 42 | % | ||||||||||||
| TOTAL REVENUES | $ | 2,427 | $ | 2,346 | 3 | % | 8 | % | $ | 2,205 | 6 | % | 7 | % | |||||||||
| EARNINGS BEFORE INTEREST AND TAXES | $ | 676 | $ | 669 | 1 | % | $ | 543 | 23 | % | |||||||||||||
(1) Other revenues consist of territories serviced by third-party licensees who pay royalties to Converse for the use of its registered trademarks and other intellectual property rights. We do not own the Converse trademarks in Japan and accordingly do not earn revenues in Japan.
FISCAL 2023 COMPARED TO FISCAL 2022
•Converse revenues increased 8% on a currency-neutral basis for fiscal 2023 due to revenue growth in North America, Western Europe and licensee markets, partially offset by declines in Asia. Combined unit sales within the wholesale and direct to consumer channels increased 1% while ASP increased 6%, driven by strategic pricing actions in Western Europe and North America.
•Direct to consumer revenues increased 8% on a currency-neutral basis, led by strong digital sales growth in North America.
•Wholesale revenues increased 7% on a currency-neutral basis, as growth in North America and Western Europe was partially offset by declines in Asia due to marketplace dynamics in China.
Reported EBIT increased 1% due to higher revenues and the following:
•Gross margin expansion of approximately 50 basis points as higher full-price ASP, net of discounts, lower other costs, and growth in licensee revenues were partially offset by higher product costs, lower margins in direct to consumer in part reflecting increased promotional activity, and unfavorable changes in standard foreign currency exchange rates.
•Selling and administrative expense increased 7% due to higher operating overhead and demand creation expense. Operating overhead expense increased primarily as a result of higher wage-related expenses. Demand creation expense increased as a result of higher advertising and marketing costs, partially offset by lower retail brand presentation costs.
2023 FORM 10-K 41
Table of Contents
CORPORATE
| (Dollars in millions) | FISCAL 2023 | FISCAL 2022 | % CHANGE | FISCAL 2021 | % CHANGE | ||||||||||||
| Revenues | $ | 27 | $ | (72) | — | $ | 40 | — | |||||||||
| Earnings (Loss) Before Interest and Taxes | $ | (2,840) | $ | (2,219) | -28 | % | $ | (2,261) | 2 | % | |||||||
Corporate revenues primarily consist of foreign currency hedge gains and losses related to revenues generated by entities within the NIKE Brand geographic operating segments and Converse, but managed through our central foreign exchange risk management program.
The Corporate loss before interest and taxes primarily consists of unallocated general and administrative expenses, including expenses associated with centrally managed departments; depreciation and amortization related to our corporate headquarters; unallocated insurance, benefit and compensation programs, including stock-based compensation; and certain foreign currency gains and losses.
In addition to the foreign currency gains and losses recognized in Corporate revenues, foreign currency results in Corporate include gains and losses resulting from the difference between actual foreign currency exchange rates and standard rates used to record non-functional currency denominated product purchases within the NIKE Brand geographic operating segments and Converse; related foreign currency hedge results; conversion gains and losses arising from remeasurement of monetary assets and liabilities in non-functional currencies; and certain other foreign currency derivative instruments.
FISCAL 2023 COMPARED TO FISCAL 2022
Corporate’s loss before interest and taxes increased $621 million during fiscal 2023, primarily due to the following:
•an unfavorable change of $371 million primarily related to higher wage and other professional services expenses, reported as a component of consolidated Operating overhead expense;
•an unfavorable change of $352 million related to the difference between actual foreign currency exchange rates and standard foreign currency exchange rates assigned to the NIKE Brand geographic operating segments and Converse, net of hedge gains and losses; these results are reported as a component of consolidated gross margin;
•an unfavorable change of $45 million largely due to net unfavorable activity related to our strategic distributor partnership transition within APLA, including the loss recognized upon completion of the sale our entities in Argentina and Uruguay to a third-party distributor in the second quarter of fiscal 2023. This was partially offset by the one-time charge related to the deconsolidation of our Russian operations recognized in the prior year, with the net amount of these activities reported as a component of consolidated Other (income) expense, net; and
•a favorable change in net foreign currency gains and losses of $174 million related to the remeasurement of monetary assets and liabilities denominated in non-functional currencies and the impact of certain foreign currency derivative instruments, reported as a component of consolidated Other (income) expense, net.
FOREIGN CURRENCY EXPOSURES AND HEDGING PRACTICES
OVERVIEW
As a global company with significant operations outside the United States, in the normal course of business we are exposed to risk arising from changes in currency exchange rates. Our primary foreign currency exposures arise from the recording of transactions denominated in non-functional currencies and the translation of foreign currency denominated results of operations, financial position and cash flows into U.S. Dollars.
Our foreign exchange risk management program is intended to lessen both the positive and negative effects of currency fluctuations on our consolidated results of operations, financial position and cash flows. We manage global foreign exchange risk centrally on a portfolio basis to address those risks material to NIKE, Inc. We manage these exposures by taking advantage of natural offsets and currency correlations existing within the portfolio and, where practical and material, by hedging a portion of the remaining exposures using derivative instruments such as forward contracts and options. As described below, the implementation of the NIKE Trading Company (“NTC”) and our foreign currency adjustment program enhanced our ability to manage our foreign exchange risk by increasing the natural offsets and currency correlation benefits existing within our portfolio of foreign exchange exposures. Our hedging policy is designed to partially or entirely offset the impact of exchange rate changes on the underlying net exposures being hedged. Where exposures are hedged, our program has the effect of delaying the impact of exchange rate movements on our Consolidated Financial Statements; the length of the delay is dependent upon hedge horizons. We do not hold or issue derivative instruments for trading or speculative purposes.
2023 FORM 10-K 42
Table of Contents
Refer to Note 4 — Fair Value Measurements and Note 12 — Risk Management and Derivatives in the accompanying Notes to the Consolidated Financial Statements for additional description of outstanding derivatives at each reported period end.
TRANSACTIONAL EXPOSURES
We conduct business in various currencies and have transactions which subject us to foreign currency risk. Our most significant transactional foreign currency exposures are:
•Product Costs — NIKE’s product costs are exposed to fluctuations in foreign currencies in the following ways:
1.Product purchases denominated in currencies other than the functional currency of the transacting entity:
a.Certain NIKE entities purchase product from the NTC, a wholly-owned sourcing hub that buys NIKE branded products from third-party factories, predominantly in U.S. Dollars. The NTC, whose functional currency is the U.S. Dollar, then sells the products to NIKE entities in their respective functional currencies. NTC sales to a NIKE entity with a different functional currency results in a foreign currency exposure for the NTC.
b.Other NIKE entities purchase product directly from third-party factories in U.S. Dollars. These purchases generate a foreign currency exposure for those NIKE entities with a functional currency other than the U.S. Dollar.
In both purchasing scenarios, a weaker U.S. Dollar reduces inventory costs incurred by NIKE whereas a stronger U.S. Dollar increases its cost.
2.Factory input costs: NIKE operates a foreign currency adjustment program with certain factories. The program is designed to more effectively manage foreign currency risk by assuming certain of the factories’ foreign currency exposures, some of which are natural offsets to our existing foreign currency exposures. Under this program, our payments to these factories are adjusted for rate fluctuations in the basket of currencies (“factory currency exposure index”) in which the labor, materials and overhead costs incurred by the factories in the production of NIKE branded products (“factory input costs”) are denominated.
As an offset to the impacts of the fluctuating U.S. Dollar on our non-functional currency denominated product purchases described above, a strengthening U.S. Dollar against the foreign currencies within the factory currency exposure indices reduces NIKE’s U.S. Dollar inventory cost. Conversely, a weakening U.S. Dollar against the indexed foreign currencies increases our inventory cost.
•Non-Functional Currency Denominated External Sales — A portion of our NIKE Brand and Converse revenues associated with European operations are earned in currencies other than the Euro (e.g., the British Pound) but are recognized at a subsidiary that uses the Euro as its functional currency. These sales generate a foreign currency exposure.
•Other Costs — Non-functional currency denominated costs, such as endorsement contracts, also generate foreign currency risk, though to a lesser extent.
•Non-Functional Currency Denominated Monetary Assets and Liabilities — Our global subsidiaries have various assets and liabilities, primarily receivables and payables, including intercompany receivables and payables, denominated in currencies other than their functional currencies. These balance sheet items are subject to remeasurement which may create fluctuations in Other (income) expense, net within our Consolidated Statements of Income.
MANAGING TRANSACTIONAL EXPOSURES
Transactional exposures are managed on a portfolio basis within our foreign currency risk management program. We manage these exposures by taking advantage of natural offsets and currency correlations that exist within the portfolio and may also elect to use currency forward and option contracts to hedge the remaining effect of exchange rate fluctuations on probable forecasted future cash flows, including certain product cost exposures, non-functional currency denominated external sales and other costs described above. Generally, these are accounted for as cash flow hedges.
2023 FORM 10-K 43
Table of Contents
Certain currency forward contracts used to manage the foreign exchange exposure of non-functional currency denominated monetary assets and liabilities subject to remeasurement are not formally designated as hedging instruments. Accordingly, changes in fair value of these instruments are recognized in Other (income) expense, net and are intended to offset the foreign currency impact of the remeasurement of the related non-functional currency denominated asset or liability being hedged.
TRANSLATIONAL EXPOSURES
Many of our foreign subsidiaries operate in functional currencies other than the U.S. Dollar. Fluctuations in currency exchange rates create volatility in our reported results as we are required to translate the balance sheets, operational results and cash flows of these subsidiaries into U.S. Dollars for consolidated reporting. The translation of foreign subsidiaries’ non-U.S. Dollar denominated balance sheets into U.S. Dollars for consolidated reporting results in a cumulative translation adjustment to Accumulated other comprehensive income (loss) within Shareholders’ equity. In the translation of our Consolidated Statements of Income, a weaker U.S. Dollar in relation to foreign functional currencies benefits our consolidated earnings whereas a stronger U.S. Dollar reduces our consolidated earnings. The impact of foreign exchange rate fluctuations on the translation of our consolidated Revenues was a detriment of approximately $2,859 million, $295 million and a benefit of approximately $893 million for the years ended May 31, 2023, 2022 and 2021, respectively. The impact of foreign exchange rate fluctuations on the translation of our Income before income taxes was a detriment of approximately $824 million, $87 million and a benefit of approximately $260 million for the years ended May 31, 2023, 2022 and 2021, respectively.
MANAGING TRANSLATIONAL EXPOSURES
To minimize the impact of translating foreign currency denominated revenues and expenses into U.S. Dollars for consolidated reporting, certain foreign subsidiaries use excess cash to purchase U.S. Dollar denominated available-for-sale investments. The variable future cash flows associated with the purchase and subsequent sale of these U.S. Dollar denominated investments at non-U.S. Dollar functional currency subsidiaries creates a foreign currency exposure that qualifies for hedge accounting under generally accepted accounting principles in the United States of America (“U.S. GAAP”). We utilize forward contracts and/or options to mitigate the variability of the forecasted future purchases and sales of these U.S. Dollar investments. The combination of the purchase and sale of the U.S. Dollar investment and the hedging instrument has the effect of partially offsetting the year-over-year foreign currency translation impact on net earnings in the period the investments are sold. Hedges of the purchase of U.S. Dollar denominated available-for-sale investments are accounted for as cash flow hedges.
We estimate the combination of translation of foreign currency-denominated profits from our international businesses and the year-over-year change in foreign currency related gains and losses included in Other (income) expense, net had an unfavorable impact of approximately $1,023 million and a favorable impact of approximately $132 million and $19 million on our Income before income taxes for the years ended May 31, 2023, 2022 and 2021, respectively.
NET INVESTMENTS IN FOREIGN SUBSIDIARIES
We are also exposed to the impact of foreign exchange fluctuations on our investments in wholly-owned foreign subsidiaries denominated in a currency other than the U.S. Dollar, which could adversely impact the U.S. Dollar value of these investments and therefore the value of future repatriated earnings. We have, in the past, hedged and may, in the future, hedge net investment positions in certain foreign subsidiaries to mitigate the effects of foreign exchange fluctuations on these net investments. These hedges are accounted for as net investment hedges in accordance with U.S. GAAP. There were no outstanding net investment hedges as of May 31, 2023 and 2022. There were no cash flows from net investment hedge settlements for the years ended May 31, 2023, 2022 and 2021.
LIQUIDITY AND CAPITAL RESOURCES
CASH FLOW ACTIVITY
Cash provided (used) by operations was an inflow of $5,841 million for fiscal 2023, compared to $5,188 million for fiscal 2022. Net income, adjusted for non-cash items, generated $6,354 million of operating cash inflow for fiscal 2023, compared to $6,848 million for fiscal 2022. The net change in working capital and other assets and liabilities resulted in a decrease to Cash provided (used) by operations of $513 million for fiscal 2023 compared to a decrease of $1,660 million for fiscal 2022. For fiscal 2023, the net change in working capital compared to the prior year was impacted by unfavorable changes in Accounts payable, offset by favorable impacts from Inventories and Accounts receivable. These changes were, in part, due to reduced inventory purchases in the current period and timing of wholesale shipments. Further impacting these changes was a lower available supply of inventory in the prior year due to supply chain constraints.
Cash provided (used) by investing activities was an inflow of $564 million for fiscal 2023, compared to an outflow of $1,524 million for fiscal 2022, primarily driven by the net change in short-term investments. For fiscal 2023, the net change in short-term
2023 FORM 10-K 44
Table of Contents
investments (including sales, maturities and purchases) resulted in a cash inflow of $1,481 million compared to a cash outflow of $747 million for fiscal 2022. Additionally, we continue to invest in our infrastructure to support future growth, specifically focused around digital capabilities, our end-to-end technology foundation, our corporate facilities and improvements across our supply chain.
Cash provided (used) by financing activities was an outflow of $7,447 million for fiscal 2023 compared to an outflow of $4,836 million for fiscal 2022. The increased outflow in fiscal 2023 was driven by higher share repurchases of $5,480 million for fiscal 2023 compared to $4,014 million for fiscal 2022, the repayment of $500 million of senior notes that matured in fiscal 2023, as well as lower proceeds from stock option exercises, which resulted in a cash inflow of $651 million in fiscal 2023 compared to $1,151 million in fiscal 2022.
In fiscal 2023, we purchased a total of 50.0 million shares of NIKE’s Class B Common Stock for $5.5 billion (an average price of $110.32 per share). In August 2022, we terminated the previous four-year, $15 billion share repurchase program approved by the Board of Directors in June 2018. Under this program, we repurchased 6.5 million shares for a total approximate cost of $710.0 million (an average price of $109.85 per share) during the first quarter of fiscal 2023 and 83.8 million shares for a total approximate cost of $9.4 billion (an average price of $111.82 per share) during the term of the program. Upon termination of the four-year, $15 billion program, we began purchasing shares under the new four-year, $18 billion share repurchase plan authorized by the Board of Directors in June 2022. As of May 31, 2023, we had repurchased 43.5 million shares at a cost of approximately $4.8 billion (an average price of $110.38 per share) under this new program. We continue to expect funding of share repurchases will come from operating cash flows. The timing and the amount of share repurchases will be dictated by our capital needs and stock market conditions.
CAPITAL RESOURCES
On July 21, 2022, we filed a shelf registration statement (the “Shelf”) with the U.S. Securities and Exchange Commission (the “SEC”) which permits us to issue an unlimited amount of debt securities from time to time. The Shelf expires on July 21, 2025.
On March 11, 2022, we entered into a five-year committed credit facility agreement with a syndicate of banks which provides for up to $2 billion of borrowings, with the option to increase borrowings up to $3 billion in total with lender approval. The facility matures on March 11, 2027, with options to extend the maturity date up to an additional two years. This facility replaces the prior $2 billion five-year credit facility agreement entered into on August 16, 2019, which would have matured on August 16, 2024. Refer to Note 5 — Short-Term Borrowings and Credit Lines for additional information.
On March 10, 2023, we entered into a 364-day committed credit facility agreement with a syndicate of banks which provides for up to $1 billion of borrowings, with the option to increase borrowings up to $1.5 billion in total with lender approval. The facility matures on March 8, 2024, with an option to extend the maturity date by 364 days. This facility replaces the prior $1 billion 364-day credit facility agreement entered into on March 11, 2022, which matured on March 10, 2023. Refer to Note 5 — Short-Term Borrowings and Credit Lines for additional information.
We currently have long-term debt ratings of AA- and A1 from Standard and Poor’s Corporation and Moody’s Investor Services, respectively. As it relates to our committed credit facilities entered into on March 11, 2022 and March 10, 2023, if our long-term debt ratings were to decline, the facility fees and interest rates would increase. Conversely, if our long-term debt ratings were to improve, the facility fees and interest rates would decrease. Changes in our long-term debt ratings would not trigger acceleration of maturity of any then-outstanding borrowings or any future borrowings under the committed credit facilities. Under these facilities, we have agreed to various covenants. These covenants include limits on the disposal of assets and the amount of debt secured by liens we may incur. In the event we were to have any borrowings outstanding under these facilities, failed to meet any covenant and were unable to obtain a waiver from a majority of the banks in the applicable syndicate, any borrowings would become immediately due and payable. As of May 31, 2023, we were in full compliance with each of these covenants, and we believe it is unlikely we will fail to meet any of these covenants in the foreseeable future.
Liquidity is also provided by our $3 billion commercial paper program. As of and for the fiscal years ended May 31, 2023 and 2022, we did not have any borrowings outstanding under our $3 billion program.
We may continue to issue commercial paper or other debt securities depending on general corporate needs.
To date, we have not experienced difficulty accessing the capital or credit markets; however, future volatility may increase costs associated with issuing commercial paper or other debt instruments or affect our ability to access those markets.
As of May 31, 2023, we had Cash and equivalents and Short-term investments totaling $10.7 billion, primarily consisting of commercial paper, corporate notes, deposits held at major banks, money market funds, U.S. Treasury obligations and other investment grade fixed-income securities. Our fixed-income investments are exposed to both credit and interest rate risk. All of our investments are investment grade to minimize our credit risk. While individual securities have varying durations, as of May 31, 2023, the weighted-average days to maturity of our cash equivalents and short-term investments portfolio was 98 days.
2023 FORM 10-K 45
Table of Contents
We believe that existing Cash and equivalents, Short-term investments and cash generated by operations, together with access to external sources of funds as described above, will be sufficient to meet our domestic and foreign capital needs in the foreseeable future.
Our material cash requirements as of May 31, 2023, were as follows:
•Debt Obligations — Refer to Note 5 — Short-Term Borrowings and Credit Lines and Note 6 — Long-Term Debt in the accompanying Notes to the Consolidated Financial Statements for further information.
•Operating Leases — Refer to Note 17 — Leases in the accompanying Notes to the Consolidated Financial Statements for further information.
•Endorsement Contracts — As of May 31, 2023, we had endorsement contract obligations of $7.6 billion, with $1.3 billion payable within 12 months, representing approximate amounts of base compensation and minimum guaranteed royalty fees we are obligated to pay athlete, public figure, sport team and league endorsers of our products. Actual payments under some contracts may be higher than these amounts as these contracts provide for bonuses to be paid to the endorsers based upon athletic achievements and/or royalties on product sales in future periods. Actual payments under some contracts may also be lower as these contracts include provisions for reduced payments if athletic performance declines in future periods. In addition to the cash payments, we are obligated to furnish our endorsers with NIKE product for their use. It is not possible to determine how much we will spend on this product on an annual basis as the amount of product provided to the endorsers will depend on many factors and the contracts generally do not stipulate a minimum amount of cash to be spent on the product.
•Product Purchase Obligations — As of May 31, 2023, we had product purchase obligations of $6.4 billion, all of which are payable within the next 12 months. Product purchase obligations represent agreements (including open purchase orders) to purchase products in the ordinary course of business that are enforceable and legally binding and specify all significant terms. We generally order product at least four to five months in advance of sale based primarily on advanced orders received from external wholesale customers and internal orders from our direct to consumer operations. In some cases, prices are subject to change throughout the production process.
•Other Purchase Obligations — As of May 31, 2023, we had $3.3 billion of other purchase obligations, with $1.7 billion payable within the next 12 months. Other purchase obligations primarily include technology investments, construction, service and marketing commitments, including marketing commitments associated with endorsement contracts, made in the ordinary course of business. The amounts represent the minimum payments required by legally binding contracts and agreements that specify all significant terms, and may include open purchase orders for non-product purchases.
In addition to the above, we have long-term obligations for uncertain tax positions and various post-retirement benefits for which we are not able to reasonably estimate when cash payments will occur. Refer to Note 7 — Income Taxes and Note 11 — Benefit Plans in the accompanying Notes to the Consolidated Financial Statements for further information related to uncertain tax positions and post-retirement benefits, respectively.
As a part of the transition tax related to the Tax Cuts and Jobs Act, as of May 31, 2023, we had $644 million in estimated future cash payments, with $161 million payable within the next 12 months. These amounts represent the transition tax on deemed repatriation of undistributed earnings of foreign subsidiaries, which are reflected net of foreign tax credits we utilized.
Refer to Note 16 — Commitments and Contingencies in the accompanying Notes to the Consolidated Financial Statements for further information related to our off-balance sheet arrangements, bank guarantees and letters of credit.
OFF-BALANCE SHEET ARRANGEMENTS
As of May 31, 2023, we did not have any off-balance sheet arrangements that have, or are reasonably likely to have, a material effect on our current and future financial condition, results of operations, liquidity, capital expenditures or capital resources. In connection with various contracts and agreements, we routinely provide indemnification relating to the enforceability of intellectual property rights, coverage for legal issues that arise and other items where we are acting as the guarantor. Currently, we have several such agreements in place. Based on our historical experience and the estimated probability of future loss, we have determined that the fair value of such indemnification is not material to our financial position or results of operations.
NEW ACCOUNTING PRONOUNCEMENTS
Refer to Note 1 — Summary of Significant Accounting Policies within the accompanying Notes to the Consolidated Financial Statements for recently adopted and issued accounting standards.
2023 FORM 10-K 46
Table of Contents
CRITICAL ACCOUNTING ESTIMATES
Our previous discussion and analysis of our financial condition and results of operations are based upon our Consolidated Financial Statements, which have been prepared in accordance with U.S. GAAP. The preparation of these financial statements requires us to make estimates and judgments that affect the reported amounts of assets, liabilities, revenues and expenses and related disclosure of contingent assets and liabilities. Note 1 — Summary of Significant Accounting Policies in the accompanying Notes to the Consolidated Financial Statements describes the significant accounting policies and methods used in the preparation of our Consolidated Financial Statements.
We believe the assumptions and judgments involved in the accounting estimates described below have the greatest potential impact on our Consolidated Financial Statements, so we consider these to be our critical accounting estimates. Management has reviewed and discussed these critical accounting estimates with the Audit & Finance Committee of the Board of Directors.
Because of the uncertainty inherent in these matters, actual results could differ from the estimates we use in the preparation of our Consolidated Financial Statements. Within the context of these critical accounting estimates, we are not currently aware of any reasonably likely events or circumstances that would result in materially different amounts being reported.
SALES-RELATED RESERVES
Provisions for anticipated sales returns consist of both contractual return rights and discretionary authorized returns. Provisions for post-invoice sales discounts consist of both contractual programs and discretionary discounts that are expected to be granted at a later date.
Estimates of discretionary authorized returns, discounts and claims are based on (1) historical rates, (2) specific identification of outstanding returns not yet received from customers and outstanding discounts and claims and (3) estimated returns, discounts and claims expected but not yet finalized with customers. Actual returns, discounts and claims in any future period are inherently uncertain and may differ from estimates recorded. If actual or expected future returns, discounts or claims were significantly different than reserves established, a reduction or increase to net revenues would be recorded in the period in which such determination was made.
Refer to Note 14 — Revenues in the accompanying Notes to the Consolidated Financial Statements for additional information.
INVENTORY RESERVES
We make ongoing estimates relating to the net realizable value of inventories based upon our assumptions about future demand and market conditions. If we estimate the net realizable value of our inventory is less than the cost of the inventory recorded on our books, we record a reserve equal to the difference between the cost of the inventory and the estimated net realizable value. This reserve is recorded as a charge to Cost of sales. If changes in market conditions result in reductions to the estimated net realizable value of our inventory below our previous estimate, we would increase our reserve in the period in which we made such a determination.
HEDGE ACCOUNTING FOR DERIVATIVES
We use derivative contracts to hedge certain anticipated foreign currency and interest rate transactions as well as certain non-functional currency monetary assets and liabilities. When the specific criteria to qualify for hedge accounting has been met, changes in the fair value of contracts hedging probable forecasted future cash flows are recorded in Accumulated other comprehensive income (loss), rather than Net income, until the underlying hedged transaction affects Net income. In most cases, this results in gains and losses on hedge derivatives being released from Accumulated other comprehensive income (loss) into Net income sometime after the maturity of the derivative. One of the criteria for this accounting treatment is that the notional value of these derivative contracts should not be in excess of the designated amount of anticipated transactions. By their very nature, our estimates of anticipated transactions may fluctuate over time and may ultimately vary from actual transactions. When the designated amount of anticipated or actual transactions decline below hedged levels, or if it is no longer probable a forecasted transaction will occur by the end of the originally specified time period or within an additional two-month period of time thereafter, we reclassify the cumulative change in fair value of the over-hedged portion of the related hedge contract from Accumulated other comprehensive income (loss) to Other (income) expense, net during the quarter in which the decrease occurs. In rare circumstances, the additional period of time may exceed two months due to extenuating circumstances related to the nature of the forecasted transaction that are outside our control or influence.
Refer to Note 12 — Risk Management and Derivatives in the accompanying Notes to the Consolidated Financial Statements for additional information.
2023 FORM 10-K 47
Table of Contents
INCOME TAXES
We are subject to taxation in the United States, as well as various state and foreign jurisdictions. The determination of our provision for income taxes requires significant judgment, the use of estimates and the interpretation and application of complex tax laws. On an interim basis, we estimate our effective tax rate for the full fiscal year. This estimated annual effective tax rate is then applied to the year-to-date Income before income taxes excluding infrequently occurring or unusual items, to determine the year-to-date Income tax expense. The income tax effects of infrequent or unusual items are recognized in the interim period in which they occur. As the fiscal year progresses, we continually refine our estimate based upon actual events and earnings by jurisdiction during the year. This continual estimation process periodically results in a change to our expected effective tax rate for the fiscal year. When this occurs, we adjust the income tax provision during the quarter in which the change in estimate occurs.
On a quarterly basis, we evaluate the probability a tax position will be effectively sustained and the appropriateness of the amount recognized for uncertain tax positions based on factors including changes in facts or circumstances, changes in tax law, settled audit issues and new audit activity. Changes in our assessment may result in the recognition of a tax benefit or an additional charge to the tax provision in the period our assessment changes. We recognize interest and penalties related to income tax matters in Income tax expense.
Refer to Note 7 — Income Taxes in the accompanying Notes to the Consolidated Financial Statements for additional information.
OTHER CONTINGENCIES
In the ordinary course of business, we are subject to various legal proceedings, claims and government investigations related to our business, products and actions of our employees and representatives, including contractual and employment relationships, product liability, antitrust, customs, tax, intellectual property and other matters. We record contingent liabilities resulting from claims against us when a loss is assessed to be probable and the amount of the loss is reasonably estimable. Assessing probability of loss and estimating probable losses requires analysis of multiple factors, including in some cases judgments about the potential actions of third-party claimants and courts. Recorded contingent liabilities are based on the best information available and actual losses in any future period are inherently uncertain. If future adjustments to estimated probable future losses or actual losses exceed our recorded liability for such claims, we would record additional charges during the period in which the actual loss or change in estimate occurred. In addition to contingent liabilities recorded for probable losses, we disclose contingent liabilities when there is a reasonable possibility the ultimate loss will materially exceed the recorded liability.
Refer to Note 16 — Commitments and Contingencies in the accompanying Notes to the Consolidated Financial Statements for additional information.
2023 FORM 10-K 48
Table of Contents
ITEM 7A. QUANTITATIVE AND QUALITATIVE DISCLOSURES ABOUT MARKET RISK
In the normal course of business and consistent with established policies and procedures, we employ a variety of financial instruments to manage exposure to fluctuations in the value of foreign currencies and interest rates. It is our policy to utilize these financial instruments only where necessary to finance our business and manage such exposures; we do not enter into these transactions for trading or speculative purposes.
We are exposed to foreign currency fluctuations, primarily as a result of our international sales, product sourcing and funding activities. Our foreign exchange risk management program is intended to lessen both the positive and negative effects of currency fluctuations on our consolidated results of operations, financial position and cash flows. We use forward and option contracts to hedge certain anticipated, but not yet firmly committed, transactions as well as certain firm commitments and the related receivables and payables, including third-party and intercompany transactions. Where exposures are hedged, our program has the effect of delaying the impact of exchange rate movements on our Consolidated Financial Statements.
The timing for hedging exposures, as well as the type and duration of the hedge instruments employed, are guided by our hedging policies and determined based upon the nature of the exposure and prevailing market conditions. Typically, the Company may enter into hedge contracts starting 12 to 24 months in advance of the forecasted transaction and may place incremental hedges up to 100% of the exposure by the time the forecasted transaction occurs. The majority of derivatives outstanding as of May 31, 2023, are designated as foreign currency cash flow hedges, primarily for Euro/U.S. Dollar, British Pound/Euro, Chinese Yuan/U.S. Dollar, and Japanese Yen/U.S. Dollar currency pairs. Refer to Note 12 — Risk Management and Derivatives in the accompanying Notes to the Consolidated Financial Statements for additional information.
Our earnings are also exposed to movements in short- and long-term market interest rates. Our objective in managing this interest rate exposure is to limit the impact of interest rate changes on earnings and cash flows and to reduce overall borrowing costs. To achieve these objectives, we maintain a mix of commercial paper, bank loans, and fixed-rate debt of varying maturities.
MARKET RISK MEASUREMENT
We monitor foreign exchange risk, interest rate risk and related derivatives using a variety of techniques including a review of market value, sensitivity analysis and Value-at-Risk (“VaR”). Our market-sensitive derivative and other financial instruments are foreign currency forward contracts, foreign currency option contracts, intercompany loans denominated in non-functional currencies and fixed interest rate U.S. Dollar denominated debt.
We use VaR to monitor the foreign exchange risk of our foreign currency forward and foreign currency option derivative instruments only. The VaR determines the maximum potential one-day loss in the fair value of these foreign exchange rate-sensitive financial instruments. The VaR model estimates assume normal market conditions and a 95% confidence level. There are various modeling techniques that can be used in the VaR computation. Our computations are based on interrelationships between currencies and interest rates (a “variance/co-variance” technique). These interrelationships are a function of foreign exchange currency market changes and interest rate changes over the preceding one-year period. The value of foreign currency options does not change on a one-to-one basis with changes in the underlying currency rate. We adjust the potential loss in option value for the estimated sensitivity (the “delta” and “gamma”) to changes in the underlying currency rate. This calculation reflects the impact of foreign currency rate fluctuations on the derivative instruments only and does not include the impact of such rate fluctuations on non-functional currency transactions (such as anticipated transactions, firm commitments, cash balances and accounts and loans receivable and payable), including those which are hedged by these instruments.
The VaR model is a risk analysis tool and does not purport to represent actual losses in fair value we will incur nor does it consider the potential effect of favorable changes in market rates. It also does not represent the full extent of the possible loss that may occur. Actual future gains and losses will differ from those estimated because of changes or differences in market rates and interrelationships, hedging instruments and hedge percentages, timing and other factors.
The estimated maximum one-day loss in fair value on our foreign currency sensitive derivative financial instruments, derived using the VaR model, was $111 million and $99 million as of May 31, 2023 and 2022, respectively. The VaR increased year-over-year as a result of an increase in foreign currency volatilities as of May 31, 2023. Such a hypothetical loss in the fair value of our derivatives would be offset by increases in the value of the underlying transactions being hedged. The average monthly change in the fair values of foreign currency forward and foreign currency option derivative instruments was $289 million and $170 million during fiscal 2023 and fiscal 2022, respectively.
The instruments not included in the VaR are intercompany loans denominated in non-functional currencies and fixed interest rate U.S. Dollar denominated debt. Intercompany loans and related interest amounts are eliminated in consolidation. Furthermore, our non-functional currency intercompany loans are substantially hedged against foreign exchange risk through the use of forward
2023 FORM 10-K 49
Table of Contents
contracts, which are included in the VaR calculation above. Therefore, we consider the interest rate and foreign currency market risks associated with our non-functional currency intercompany loans to be immaterial to our consolidated financial position, results of operations and cash flows.
Details of third-party debt are provided in the table below. The table presents principal cash flows and related weighted average interest rates by expected maturity dates.
| EXPECTED MATURITY DATE YEAR ENDING MAY 31, | ||||||||||||||||||||||||||
| (Dollars in millions) | 2024 | 2025 | 2026 | 2027 | 2028 | THEREAFTER | TOTAL | FAIR VALUE | ||||||||||||||||||
| Interest Rate Risk | ||||||||||||||||||||||||||
| Long-term U.S. Dollar debt — Fixed rate | ||||||||||||||||||||||||||
| Principal payments | $ | — | $ | 1,000 | $ | — | $ | 2,000 | $ | — | $ | 6,000 | $ | 9,000 | $ | 7,889 | ||||||||||
| Average interest rate | 0.0 | % | 2.4 | % | 0.0 | % | 2.6 | % | 0.0 | % | 3.3 | % | 3.1 | % | ||||||||||||
2023 FORM 10-K 50
Table of Contents
ITEM 8. FINANCIAL STATEMENTS AND SUPPLEMENTARY DATA
Management of NIKE, Inc. is responsible for the information and representations contained in this Annual Report. The financial statements have been prepared in conformity with accounting principles generally accepted in the United States of America (“U.S. GAAP”) and include certain amounts based on our best estimates and judgments. Other financial information in this Annual Report is consistent with these financial statements.
Our accounting systems include controls designed to reasonably assure assets are safeguarded from unauthorized use or disposition and provide for the preparation of financial statements in conformity with U.S. GAAP. These systems are supplemented by the selection and training of qualified financial personnel and an organizational structure providing for appropriate segregation of duties.
An internal corporate audit department reviews the results of its work with the Audit & Finance Committee of the Board of Directors, presently comprised of four outside, independent directors. The Audit & Finance Committee is responsible for the appointment of the independent registered public accounting firm and reviews, with the independent registered public accounting firm, management and the internal corporate audit staff, the scope and the results of the annual audit, the effectiveness of the accounting control system and other matters relating to the financial affairs of NIKE as the Audit & Finance Committee deems appropriate. The independent registered public accounting firm and the internal corporate auditors have full access to the Audit & Finance Committee, with and without the presence of management, to discuss any appropriate matters.
2023 FORM 10-K 51
Table of Contents
MANAGEMENT’S ANNUAL REPORT ON INTERNAL CONTROL OVER FINANCIAL REPORTING
Management is responsible for establishing and maintaining adequate internal control over financial reporting, as such term is defined in Rule 13(a) – 15(f) and Rule 15(d) – 15(f) of the Securities Exchange Act of 1934, as amended. Internal control over financial reporting is a process designed to provide reasonable assurance regarding the reliability of financial reporting and the preparation of the financial statements for external purposes in accordance with generally accepted accounting principles in the United States of America. Internal control over financial reporting includes those policies and procedures that: (i) pertain to the maintenance of records that, in reasonable detail, accurately and fairly reflect the transactions and dispositions of assets of the Company; (ii) provide reasonable assurance that transactions are recorded as necessary to permit preparation of financial statements in accordance with generally accepted accounting principles, and that receipts and expenditures of the Company are being made only in accordance with authorizations of our management and directors; and (iii) provide reasonable assurance regarding prevention or timely detection of unauthorized acquisition, use or disposition of assets of the Company that could have a material effect on the financial statements.
Because of its inherent limitations, internal control over financial reporting may not prevent or detect misstatements. Also, projections of any evaluation of effectiveness to future periods are subject to the risk that controls may become inadequate because of changes in conditions, or that the degree of compliance with the policies or procedures may deteriorate.
Under the supervision and with the participation of our Chief Executive Officer and Chief Financial Officer, our management conducted an evaluation of the effectiveness of our internal control over financial reporting based upon the framework in Internal Control — Integrated Framework (2013) issued by the Committee of Sponsoring Organizations of the Treadway Commission (COSO). Based on the results of our evaluation, our management concluded that our internal control over financial reporting was effective as of May 31, 2023.
PricewaterhouseCoopers LLP, an independent registered public accounting firm, has audited (1) the Consolidated Financial Statements and (2) the effectiveness of our internal control over financial reporting as of May 31, 2023, as stated in their report herein.
| John J. Donahoe II | Matthew Friend | ||||
| President and Chief Executive Officer | Executive Vice President and Chief Financial Officer | ||||
2023 FORM 10-K 52
Table of Contents
Report of Independent Registered Public Accounting Firm
To the Board of Directors and Shareholders of NIKE, Inc.
Opinions on the Financial Statements and Internal Control over Financial Reporting
We have audited the accompanying consolidated balance sheets of NIKE, Inc. and its subsidiaries (the “Company”) as of May 31, 2023 and 2022, and the related consolidated statements of income, of comprehensive income, of shareholders’ equity and of cash flows for each of the three years in the period ended May 31, 2023, including the related notes and financial statement schedule listed in the index appearing under Item 15(a)(2) (collectively referred to as the “consolidated financial statements”). We also have audited the Company’s internal control over financial reporting as of May 31, 2023, based on criteria established in Internal Control – Integrated Framework (2013) issued by the Committee of Sponsoring Organizations of the Treadway Commission (COSO).
In our opinion, the consolidated financial statements referred to above present fairly, in all material respects, the financial position of the Company as of May 31, 2023 and 2022, and the results of its operations and its cash flows for each of the three years in the period ended May 31, 2023 in conformity with accounting principles generally accepted in the United States of America. Also in our opinion, the Company maintained, in all material respects, effective internal control over financial reporting as of May 31, 2023, based on criteria established in Internal Control – Integrated Framework (2013) issued by the COSO.
Basis for Opinions
The Company’s management is responsible for these consolidated financial statements, for maintaining effective internal control over financial reporting, and for its assessment of the effectiveness of internal control over financial reporting, included in the accompanying Management’s Annual Report on Internal Control over Financial Reporting. Our responsibility is to express opinions on the Company’s consolidated financial statements and on the Company’s internal control over financial reporting based on our audits. We are a public accounting firm registered with the Public Company Accounting Oversight Board (United States) (PCAOB) and are required to be independent with respect to the Company in accordance with the U.S. federal securities laws and the applicable rules and regulations of the Securities and Exchange Commission and the PCAOB.
We conducted our audits in accordance with the standards of the PCAOB. Those standards require that we plan and perform the audits to obtain reasonable assurance about whether the consolidated financial statements are free of material misstatement, whether due to error or fraud, and whether effective internal control over financial reporting was maintained in all material respects.
Our audits of the consolidated financial statements included performing procedures to assess the risks of material misstatement of the consolidated financial statements, whether due to error or fraud, and performing procedures that respond to those risks. Such procedures included examining, on a test basis, evidence regarding the amounts and disclosures in the consolidated financial statements. Our audits also included evaluating the accounting principles used and significant estimates made by management, as well as evaluating the overall presentation of the consolidated financial statements. Our audit of internal control over financial reporting included obtaining an understanding of internal control over financial reporting, assessing the risk that a material weakness exists, and testing and evaluating the design and operating effectiveness of internal control based on the assessed risk. Our audits also included performing such other procedures as we considered necessary in the circumstances. We believe that our audits provide a reasonable basis for our opinions.
Definition and Limitations of Internal Control over Financial Reporting
A company’s internal control over financial reporting is a process designed to provide reasonable assurance regarding the reliability of financial reporting and the preparation of financial statements for external purposes in accordance with generally accepted accounting principles. A company’s internal control over financial reporting includes those policies and procedures that (i) pertain to the maintenance of records that, in reasonable detail, accurately and fairly reflect the transactions and dispositions of the assets of the company; (ii) provide reasonable assurance that transactions are recorded as necessary to permit preparation of financial statements in accordance with generally accepted accounting principles, and that receipts and expenditures of the company are being made only in accordance with authorizations of management and directors of the company; and (iii) provide reasonable assurance regarding prevention or timely detection of unauthorized acquisition, use, or disposition of the company’s assets that could have a material effect on the financial statements.
Because of its inherent limitations, internal control over financial reporting may not prevent or detect misstatements. Also, projections of any evaluation of effectiveness to future periods are subject to the risk that controls may become inadequate because of changes in conditions, or that the degree of compliance with the policies or procedures may deteriorate.
2023 FORM 10-K 53
Table of Contents
Critical Audit Matters
The critical audit matter communicated below is a matter arising from the current period audit of the consolidated financial statements that was communicated or required to be communicated to the audit committee and that (i) relates to accounts or disclosures that are material to the consolidated financial statements and (ii) involved our especially challenging, subjective, or complex judgments. The communication of critical audit matters does not alter in any way our opinion on the consolidated financial statements, taken as a whole, and we are not, by communicating the critical audit matter below, providing a separate opinion on the critical audit matter or on the accounts or disclosures to which it relates.
Accounting for Income Taxes
As described in Notes 1 and 7 to the consolidated financial statements, the Company recorded income tax expense of $1,131 million for the year ended May 31, 2023, and has net deferred tax assets of $1,799 million, including a valuation allowance of $22 million, and total gross unrecognized tax benefits, excluding related interest and penalties, of $936 million as of May 31, 2023, $651 million of which would affect the Company’s effective tax rate if recognized in future periods. The realization of deferred tax assets is dependent on future taxable earnings. Management assesses the scheduled reversal of deferred tax liabilities, projected future taxable income and available tax planning strategies and considers foreign tax credit utilization in making this assessment of realization. A valuation allowance is established against the net deferred tax asset to the extent that recovery is not likely. The Company is subject to taxation in the United States, as well as various state and foreign jurisdictions. As disclosed by management, the use of significant judgment and estimates, as well as the interpretation and application of complex tax laws is required by management to determine the Company’s provision for income taxes.
The principal considerations for our determination that performing procedures relating to the accounting for income taxes is a critical audit matter are a high degree of auditor judgment, subjectivity and effort in performing procedures and evaluating audit evidence relating to management’s assessment of complex tax laws and regulations as it relates to determining the provision for income taxes. In addition, the audit effort involved the use of professionals with specialized skill and knowledge.
Addressing the matter involved performing procedures and evaluating audit evidence in connection with forming our overall opinion on the consolidated financial statements. These procedures included testing the effectiveness of controls relating to income taxes, evaluating changes in and compliance with tax laws, and testing the calculation of the provision of income taxes. Professionals with specialized skill and knowledge were used to assist in evaluating changes in and compliance with the tax laws and regulations and the provision for income taxes.
/s/ PricewaterhouseCoopers LLP
Portland, Oregon
July 20, 2023
We have served as the Company’s auditor since 1974.
2023 FORM 10-K 54
Table of Contents
NIKE, INC.
CONSOLIDATED STATEMENTS OF INCOME
| YEAR ENDED MAY 31, | |||||||||||
| (In millions, except per share data) | 2023 | 2022 | 2021 | ||||||||
| Revenues | $ | 51,217 | $ | 46,710 | $ | 44,538 | |||||
| Cost of sales | 28,925 | 25,231 | 24,576 | ||||||||
| Gross profit | 22,292 | 21,479 | 19,962 | ||||||||
| Demand creation expense | 4,060 | 3,850 | 3,114 | ||||||||
| Operating overhead expense | 12,317 | 10,954 | 9,911 | ||||||||
| Total selling and administrative expense | 16,377 | 14,804 | 13,025 | ||||||||
| Interest expense (income), net | (6) | 205 | 262 | ||||||||
| Other (income) expense, net | (280) | (181) | 14 | ||||||||
| Income before income taxes | 6,201 | 6,651 | 6,661 | ||||||||
| Income tax expense | 1,131 | 605 | 934 | ||||||||
| NET INCOME | $ | 5,070 | $ | 6,046 | $ | 5,727 | |||||
| Earnings per common share: | |||||||||||
| Basic | $ | 3.27 | $ | 3.83 | $ | 3.64 | |||||
| Diluted | $ | 3.23 | $ | 3.75 | $ | 3.56 | |||||
| Weighted average common shares outstanding: | |||||||||||
| Basic | 1,551.6 | 1,578.8 | 1,573.0 | ||||||||
| Diluted | 1,569.8 | 1,610.8 | 1,609.4 | ||||||||
The accompanying Notes to the Consolidated Financial Statements are an integral part of this statement.
2023 FORM 10-K 55
Table of Contents
NIKE, INC.
CONSOLIDATED STATEMENTS OF COMPREHENSIVE INCOME
| YEAR ENDED MAY 31, | |||||||||||
| (Dollars in millions) | 2023 | 2022 | 2021 | ||||||||
| Net income | $ | 5,070 | $ | 6,046 | $ | 5,727 | |||||
| Other comprehensive income (loss), net of tax: | |||||||||||
| Change in net foreign currency translation adjustment | 267 | (522) | 496 | ||||||||
| Change in net gains (losses) on cash flow hedges | (348) | 1,214 | (825) | ||||||||
| Change in net gains (losses) on other | (6) | 6 | 5 | ||||||||
| Total other comprehensive income (loss), net of tax | (87) | 698 | (324) | ||||||||
| TOTAL COMPREHENSIVE INCOME | $ | 4,983 | $ | 6,744 | $ | 5,403 | |||||
The accompanying Notes to the Consolidated Financial Statements are an integral part of this statement.
2023 FORM 10-K 56
Table of Contents
NIKE, INC.
CONSOLIDATED BALANCE SHEETS
| MAY 31, | ||||||||
| (In millions) | 2023 | 2022 | ||||||
| ASSETS | ||||||||
| Current assets: | ||||||||
| Cash and equivalents | $ | 7,441 | $ | 8,574 | ||||
| Short-term investments | 3,234 | 4,423 | ||||||
| Accounts receivable, net | 4,131 | 4,667 | ||||||
| Inventories | 8,454 | 8,420 | ||||||
| Prepaid expenses and other current assets | 1,942 | 2,129 | ||||||
| Total current assets | 25,202 | 28,213 | ||||||
| Property, plant and equipment, net | 5,081 | 4,791 | ||||||
| Operating lease right-of-use assets, net | 2,923 | 2,926 | ||||||
| Identifiable intangible assets, net | 274 | 286 | ||||||
| Goodwill | 281 | 284 | ||||||
| Deferred income taxes and other assets | 3,770 | 3,821 | ||||||
| TOTAL ASSETS | $ | 37,531 | $ | 40,321 | ||||
| LIABILITIES AND SHAREHOLDERS’ EQUITY | ||||||||
| Current liabilities: | ||||||||
| Current portion of long-term debt | $ | — | $ | 500 | ||||
| Notes payable | 6 | 10 | ||||||
| Accounts payable | 2,862 | 3,358 | ||||||
| Current portion of operating lease liabilities | 425 | 420 | ||||||
| Accrued liabilities | 5,723 | 6,220 | ||||||
| Income taxes payable | 240 | 222 | ||||||
| Total current liabilities | 9,256 | 10,730 | ||||||
| Long-term debt | 8,927 | 8,920 | ||||||
| Operating lease liabilities | 2,786 | 2,777 | ||||||
| Deferred income taxes and other liabilities | 2,558 | 2,613 | ||||||
| Commitments and contingencies (Note 16) | ||||||||
| Redeemable preferred stock | — | — | ||||||
| Shareholders’ equity: | ||||||||
| Common stock at stated value: | ||||||||
| Class A convertible — 305 and 305 shares outstanding | — | — | ||||||
| Class B — 1,227 and 1,266 shares outstanding | 3 | 3 | ||||||
| Capital in excess of stated value | 12,412 | 11,484 | ||||||
| Accumulated other comprehensive income (loss) | 231 | 318 | ||||||
| Retained earnings (deficit) | 1,358 | 3,476 | ||||||
| Total shareholders’ equity | 14,004 | 15,281 | ||||||
| TOTAL LIABILITIES AND SHAREHOLDERS’ EQUITY | $ | 37,531 | $ | 40,321 | ||||
The accompanying Notes to the Consolidated Financial Statements are an integral part of this statement.
2023 FORM 10-K 57
Table of Contents
NIKE, INC.
CONSOLIDATED STATEMENTS OF CASH FLOWS
| YEAR ENDED MAY 31, | |||||||||||
| (Dollars in millions) | 2023 | 2022 | 2021 | ||||||||
| Cash provided (used) by operations: | |||||||||||
| Net income | $ | 5,070 | $ | 6,046 | $ | 5,727 | |||||
| Adjustments to reconcile net income to net cash provided (used) by operations: | |||||||||||
| Depreciation | 703 | 717 | 744 | ||||||||
| Deferred income taxes | (117) | (650) | (385) | ||||||||
| Stock-based compensation | 755 | 638 | 611 | ||||||||
| Amortization, impairment and other | 156 | 123 | 53 | ||||||||
| Net foreign currency adjustments | (213) | (26) | (138) | ||||||||
| Changes in certain working capital components and other assets and liabilities: | |||||||||||
| (Increase) decrease in accounts receivable | 489 | (504) | (1,606) | ||||||||
| (Increase) decrease in inventories | (133) | (1,676) | 507 | ||||||||
| (Increase) decrease in prepaid expenses, operating lease right-of-use assets and other current and non-current assets | (644) | (845) | (182) | ||||||||
| Increase (decrease) in accounts payable, accrued liabilities, operating lease liabilities and other current and non-current liabilities | (225) | 1,365 | 1,326 | ||||||||
| Cash provided (used) by operations | 5,841 | 5,188 | 6,657 | ||||||||
| Cash provided (used) by investing activities: | |||||||||||
| Purchases of short-term investments | (6,059) | (12,913) | (9,961) | ||||||||
| Maturities of short-term investments | 3,356 | 8,199 | 4,236 | ||||||||
| Sales of short-term investments | 4,184 | 3,967 | 2,449 | ||||||||
| Additions to property, plant and equipment | (969) | (758) | (695) | ||||||||
| Other investing activities | 52 | (19) | 171 | ||||||||
| Cash provided (used) by investing activities | 564 | (1,524) | (3,800) | ||||||||
| Cash provided (used) by financing activities: | |||||||||||
| Increase (decrease) in notes payable, net | (4) | 15 | (52) | ||||||||
| Repayment of borrowings | (500) | — | (197) | ||||||||
| Proceeds from exercise of stock options and other stock issuances | 651 | 1,151 | 1,172 | ||||||||
| Repurchase of common stock | (5,480) | (4,014) | (608) | ||||||||
| Dividends — common and preferred | (2,012) | (1,837) | (1,638) | ||||||||
| Other financing activities | (102) | (151) | (136) | ||||||||
| Cash provided (used) by financing activities | (7,447) | (4,836) | (1,459) | ||||||||
| Effect of exchange rate changes on cash and equivalents | (91) | (143) | 143 | ||||||||
| Net increase (decrease) in cash and equivalents | (1,133) | (1,315) | 1,541 | ||||||||
| Cash and equivalents, beginning of year | 8,574 | 9,889 | 8,348 | ||||||||
| CASH AND EQUIVALENTS, END OF YEAR | $ | 7,441 | $ | 8,574 | $ | 9,889 | |||||
| Supplemental disclosure of cash flow information: | |||||||||||
| Cash paid during the year for: | |||||||||||
| Interest, net of capitalized interest | $ | 347 | $ | 290 | $ | 293 | |||||
| Income taxes | 1,517 | 1,231 | 1,177 | ||||||||
| Non-cash additions to property, plant and equipment | 211 | 160 | 179 | ||||||||
| Dividends declared and not paid | 524 | 480 | 438 | ||||||||
The accompanying Notes to the Consolidated Financial Statements are an integral part of this statement.
2023 FORM 10-K 58
Table of Contents
NIKE, INC.
CONSOLIDATED STATEMENTS OF SHAREHOLDERS’ EQUITY
| COMMON STOCK | CAPITAL IN EXCESS OF STATED VALUE | ACCUMULATED OTHER COMPREHENSIVE INCOME (LOSS) | RETAINED EARNINGS (DEFICIT) | TOTAL | |||||||||||||||||||||||||
| CLASS A | CLASS B | ||||||||||||||||||||||||||||
| (In millions, except per share data) | SHARES | AMOUNT | SHARES | AMOUNT | |||||||||||||||||||||||||
| Balance at May 31, 2020 | 315 | $ | — | 1,243 | $ | 3 | $ | 8,299 | $ | (56) | $ | (191) | $ | 8,055 | |||||||||||||||
| Stock options exercised | 21 | 954 | 954 | ||||||||||||||||||||||||||
| Conversion to Class B Common Stock | (10) | 10 | — | ||||||||||||||||||||||||||
| Repurchase of Class B Common Stock | (5) | (28) | (622) | (650) | |||||||||||||||||||||||||
| Dividends on common stock ($1.070 per share) and preferred stock ($0.10 per share) | (1,692) | (1,692) | |||||||||||||||||||||||||||
| Issuance of shares to employees, net of shares withheld for employee taxes | 4 | 129 | (43) | 86 | |||||||||||||||||||||||||
| Stock-based compensation | 611 | 611 | |||||||||||||||||||||||||||
| Net income | 5,727 | 5,727 | |||||||||||||||||||||||||||
| Other comprehensive income (loss) | (324) | (324) | |||||||||||||||||||||||||||
| Balance at May 31, 2021 | 305 | $ | — | 1,273 | $ | 3 | $ | 9,965 | $ | (380) | $ | 3,179 | $ | 12,767 | |||||||||||||||
| Stock options exercised | 17 | 924 | 924 | ||||||||||||||||||||||||||
| Repurchase of Class B Common Stock | (27) | (186) | (3,808) | (3,994) | |||||||||||||||||||||||||
| Dividends on common stock ($1.190 per share) and preferred stock ($0.10 per share) | (1,886) | (1,886) | |||||||||||||||||||||||||||
| Issuance of shares to employees, net of shares withheld for employee taxes | 3 | 143 | (55) | 88 | |||||||||||||||||||||||||
| Stock-based compensation | 638 | 638 | |||||||||||||||||||||||||||
| Net income | 6,046 | 6,046 | |||||||||||||||||||||||||||
| Other comprehensive income (loss) | 698 | 698 | |||||||||||||||||||||||||||
| Balance at May 31, 2022 | 305 | $ | — | 1,266 | $ | 3 | $ | 11,484 | $ | 318 | $ | 3,476 | $ | 15,281 | |||||||||||||||
| Stock options exercised | 8 | 421 | 421 | ||||||||||||||||||||||||||
| Repurchase of Class B Common Stock | (51) | (378) | (5,131) | (5,509) | |||||||||||||||||||||||||
| Dividends on common stock ($1.325 per share) and preferred stock ($0.10 per share) | (2,059) | (2,059) | |||||||||||||||||||||||||||
| Issuance of shares to employees, net of shares withheld for employee taxes | 4 | 130 | 2 | 132 | |||||||||||||||||||||||||
| Stock-based compensation | 755 | 755 | |||||||||||||||||||||||||||
| Net income | 5,070 | 5,070 | |||||||||||||||||||||||||||
| Other comprehensive income (loss) | (87) | (87) | |||||||||||||||||||||||||||
| Balance at May 31, 2023 | 305 | $ | — | 1,227 | $ | 3 | $ | 12,412 | $ | 231 | $ | 1,358 | $ | 14,004 | |||||||||||||||
The accompanying Notes to the Consolidated Financial Statements are an integral part of this statement.
2023 FORM 10-K 59
Table of Contents
NOTES TO CONSOLIDATED FINANCIAL STATEMENTS
| Note 1 | Summary of Significant Accounting Policies | 61 | ||||||
| Note 2 | Property, Plant and Equipment | 67 | ||||||
| Note 3 | Accrued Liabilities | 67 | ||||||
| Note 4 | Fair Value Measurements | 68 | ||||||
| Note 5 | Short-Term Borrowings and Credit Lines | 70 | ||||||
| Note 6 | Long-Term Debt | 71 | ||||||
| Note 7 | Income Taxes | 72 | ||||||
| Note 8 | Redeemable Preferred Stock | 74 | ||||||
| Note 9 | Common Stock and Stock-Based Compensation | 74 | ||||||
| Note 10 | Earnings Per Share | 77 | ||||||
| Note 11 | Benefit Plans | 77 | ||||||
| Note 12 | Risk Management and Derivatives | 77 | ||||||
| Note 13 | Accumulated Other Comprehensive Income (Loss) | 81 | ||||||
| Note 14 | Revenues | 83 | ||||||
| Note 15 | Operating Segments and Related Information | 84 | ||||||
| Note 16 | Commitments and Contingencies | 88 | ||||||
| Note 17 | Leases | 88 | ||||||
| Note 18 | Acquisitions and Divestitures | 89 | ||||||
| Note 19 | Restructuring | 90 | ||||||
2023 FORM 10-K 60
Table of Contents
| NOTE 1 — SUMMARY OF SIGNIFICANT ACCOUNTING POLICIES | ||
DESCRIPTION OF BUSINESS
NIKE, Inc. is a worldwide leader in the design, development and worldwide marketing and selling of athletic footwear, apparel, equipment, accessories and services. NIKE, Inc. portfolio brands include the NIKE Brand, Jordan Brand and Converse. The NIKE Brand is focused on performance athletic footwear, apparel, equipment, accessories and services across Men’s, Women’s and Kids’, amplified with sport-inspired lifestyle products carrying the Swoosh trademark, as well as other NIKE Brand trademarks. The Jordan Brand is focused on athletic and casual footwear, apparel and accessories using the Jumpman trademark. Sales and operating results of Jordan Brand products are reported within the respective NIKE Brand geographic operating segments. Converse designs, distributes, licenses and sells casual sneakers, apparel and accessories under the Converse, Chuck Taylor, All Star, One Star, Star Chevron and Jack Purcell trademarks. In some markets outside the U.S., these trademarks are licensed to third parties who design, distribute, market and sell similar products. Operating results of the Converse brand are reported on a stand-alone basis.
BASIS OF CONSOLIDATION
The Consolidated Financial Statements include the accounts of NIKE, Inc. and its subsidiaries (the “Company” or “NIKE”). All significant intercompany transactions and balances have been eliminated.
REVENUE RECOGNITION
Revenue transactions associated with the sale of NIKE Brand footwear, apparel and equipment, as well as Converse products, comprise a single performance obligation, which consists of the sale of products to customers either through wholesale or direct to consumer channels. The Company satisfies the performance obligation and records revenues when transfer of control to the customer has occurred, based on the terms of sale. A customer is considered to have control once they are able to direct the use and receive substantially all of the benefits of the product.
Control is transferred to wholesale customers upon shipment or upon receipt depending on the country of the sale and the agreement with the customer. Control transfers to retail store customers at the time of sale and to substantially all digital commerce customers upon shipment. The transaction price is determined based upon the invoiced sales price, less anticipated sales returns, discounts and miscellaneous claims from customers. Payment terms for wholesale transactions depend on the country of sale or agreement with the customer and payment is generally required within 90 days or less of shipment to or receipt by the wholesale customer. Payment is due at the time of sale for retail store and digital commerce transactions.
Consideration for trademark licensing contracts is earned through sales-based or usage-based royalty arrangements, and the associated revenues are recognized over the license period.
Taxes assessed by governmental authorities that are both imposed on and concurrent with a specific revenue-producing transaction, and are collected by the Company from a customer, are excluded from Revenues and Cost of sales in the Consolidated Statements of Income. Shipping and handling costs associated with outbound freight after control over a product has transferred to a customer are accounted for as fulfillment costs and are included in Cost of sales when the related revenues are recognized.
SALES-RELATED RESERVES
Consideration promised in the Company’s contracts with customers is variable due to anticipated reductions, such as sales returns, discounts and miscellaneous claims from customers. The Company estimates the most likely amount it will be entitled to receive and records an anticipated reduction against Revenues, with an offsetting increase to Accrued liabilities at the time revenues are recognized. The estimated cost of inventory for product returns is recorded in Prepaid expenses and other current assets on the Consolidated Balance Sheets.
The provision for anticipated sales returns consists of both contractual return rights and discretionary authorized returns. Provisions for post-invoice sales discounts consist of both contractual programs and discretionary discounts that are expected to be granted at a later date.
Estimates of discretionary authorized returns, discounts and claims are based on (1) historical rates, (2) specific identification of outstanding returns not yet received from customers and outstanding discounts and claims and (3) estimated returns, discounts and claims expected but not yet finalized with customers. Actual returns, discounts and claims in any future period are inherently uncertain and thus may differ from estimates recorded. If actual or expected future returns, discounts or claims are significantly greater or lower than the reserves established, a reduction or increase to net Revenues is recorded in the period in which such determination is made.
2023 FORM 10-K 61
Table of Contents
COST OF SALES
Cost of sales consists primarily of inventory costs, as well as warehousing costs (including the cost of warehouse labor), third-party royalties, certain foreign currency hedge gains and losses and product design costs. Shipping and handling costs are expensed as incurred and included in Cost of sales.
DEMAND CREATION EXPENSE
Demand creation expense consists of advertising and promotion costs, including costs of endorsement contracts, complimentary products, television, digital and print advertising as well as media costs, brand events and retail brand presentation. Advertising production costs are expensed the first time an advertisement is run. Advertising media costs are expensed when the advertisement appears. Costs related to brand events are expensed when the event occurs. Costs related to retail brand presentation are expensed when the presentation is complete and delivered.
A significant amount of the Company’s promotional expenses result from payments under endorsement contracts. In general, endorsement payments are expensed on a straight-line basis over the term of the contract. However, certain contracts contain elements that may be accounted for differently based upon the facts and circumstances of each individual contract. Prepayments made under contracts are included in Prepaid expenses and other current assets or Deferred income taxes and other assets depending on the period to which the prepayment applies.
Certain contracts provide for contingent payments to endorsers based upon specific achievements in their sport (e.g., winning a championship). The Company records Demand creation expense for these amounts when the endorser achieves the specific goal.
Certain contracts provide for variable payments based upon endorsers maintaining a level of performance in their sport over an extended period of time (e.g., maintaining a specified ranking in a sport for a year). When the Company determines payments are probable, the amounts are reported in Demand creation expense ratably over the contract period based on the Company’s best estimate of the endorser’s performance. In these instances, to the extent actual payments to the endorser differ from the Company’s estimate due to changes in the endorser’s performance, adjustments to Demand creation expense may be recorded in a future period.
Certain contracts provide for royalty payments to endorsers based upon a predetermined percent of sales of particular products, which the Company records in Cost of sales as the related sales occur. For contracts containing minimum guaranteed royalty payments, the Company records the amount of any guaranteed payment in excess of that earned through sales of product within Demand creation expense.
Through cooperative advertising programs, the Company reimburses its wholesale customers for certain costs of advertising the Company’s products. To the extent the Company receives a distinct good or service in exchange for consideration paid to the customer that does not exceed the fair value of that good or service, the amounts reimbursed are recorded in Demand creation expense.
Total Demand creation expense was $4,060 million, $3,850 million and $3,114 million for the years ended May 31, 2023, 2022 and 2021, respectively. Prepaid advertising and promotion expenses totaled $755 million and $773 million at May 31, 2023 and 2022, respectively, of which $372 million and $329 million, respectively, were recorded in Prepaid expenses and other current assets, and $383 million and $444 million, respectively, were recorded in Deferred income taxes and other assets, depending on the period to which the prepayment applied.
OPERATING OVERHEAD EXPENSE
Operating overhead expense consists primarily of wage and benefit-related expenses, research and development costs, bad debt expense as well as other administrative expenses such as rent, depreciation and amortization, professional services, certain technology investments, meetings and travel.
CASH AND EQUIVALENTS
Cash and equivalents represent cash and short-term, highly liquid investments, that are both readily convertible to known amounts of cash and so near their maturity they present insignificant risk of changes in value because of changes in interest rates, with maturities three months or less at the date of purchase.
2023 FORM 10-K 62
Table of Contents
SHORT-TERM INVESTMENTS
Short-term investments consist of highly liquid investments with maturities over three months at the date of purchase. At May 31, 2023 and 2022, Short-term investments consisted of available-for-sale debt securities, which are recorded at fair value with unrealized gains and losses reported, net of tax, in Accumulated other comprehensive income (loss), unless unrealized losses are determined to be unrecoverable. Realized gains and losses on the sale of securities are determined by specific identification. The Company considers all available-for-sale debt securities, including those with maturity dates beyond 12 months, as available to support current operational liquidity needs and, therefore, classifies all securities with maturity dates beyond three months at the date of purchase as current assets within Short-term investments on the Consolidated Balance Sheets.
Refer to Note 4 — Fair Value Measurements for more information on the Company’s Short-term investments.
ALLOWANCE FOR UNCOLLECTIBLE ACCOUNTS RECEIVABLEAccounts receivable, net
consist primarily of amounts due from customers. The Company makes ongoing estimates relating to the collectability of its accounts receivable and maintains an allowance for expected losses resulting from the inability of its customers to make required payments. In addition to judgments about the creditworthiness of significant customers based on ongoing credit evaluations, the Company considers historical levels of credit losses, as well as macroeconomic and industry trends to determine the amount of the allowance. The allowance for uncollectible accounts receivable was $35 million and $34 million as of May 31, 2023 and 2022, respectively.
INVENTORY VALUATION
Inventories, substantially all of which are finished goods, are stated at lower of cost and net realizable value and valued on either an average or a specific identification cost basis. In some instances, the Company ships products directly from its suppliers to the customer, with the related inventory and cost of sales recognized on a specific identification basis. Inventory costs primarily consist of product cost from the Company’s suppliers, as well as inbound freight, import duties, taxes, insurance, logistics and other handling fees.
PROPERTY, PLANT AND EQUIPMENT AND DEPRECIATION
Property, plant and equipment are recorded at cost. Depreciation is determined on a straight-line basis for land improvements, buildings and leasehold improvements over 2 to 40 years and for machinery and equipment over 2 to 15 years.
Depreciation and amortization of assets used in manufacturing, warehousing and product distribution are recorded in Cost of sales. Depreciation and amortization of all other assets are recorded in Operating overhead expense.
SOFTWARE DEVELOPMENT COSTS
Expenditures for major software purchases and software developed for internal use are capitalized and amortized over 2 to 12 years on a straight-line basis. The Company’s policy provides for the capitalization of external direct costs associated with developing or obtaining internal use computer software. The Company also capitalizes certain payroll and payroll-related costs for employees who are directly associated with internal use computer software projects. The amount of capitalizable payroll costs with respect to these employees is limited to the time directly spent on such projects. Costs associated with preliminary project stage activities, training, maintenance and all other post-implementation stage activities are expensed as incurred.
Development costs of computer software to be sold, leased or otherwise marketed as an integral part of a product are subject to capitalization beginning when a product’s technological feasibility has been established and ending when a product is available for general release to customers. In most instances, the Company’s products are released soon after technological feasibility has been established; therefore, software development costs incurred subsequent to achievement of technological feasibility are usually not significant, and generally, most software development costs have been expensed as incurred.
2023 FORM 10-K 63
Table of Contents
IMPAIRMENT OF LONG-LIVED ASSETS
The Company reviews the carrying value of long-lived assets or asset groups to be used in operations whenever events or changes in circumstances indicate the carrying amount of the assets might not be recoverable. Factors that would necessitate an impairment assessment include a significant adverse change in the extent or manner in which an asset is used, a significant adverse change in legal factors or the business climate that could affect the value of the asset or a significant decline in the observable market value of an asset, among others. If such facts indicate a potential impairment, the Company would assess the recoverability of an asset group by determining if the carrying value of the asset group exceeds the sum of the projected undiscounted cash flows expected to result from the use and eventual disposition of the assets over the remaining economic life of the primary asset in the asset group. If the recoverability test indicates that the carrying value of the asset group is not recoverable, the Company will estimate the fair value of the asset group using appropriate valuation methodologies, which would typically include an estimate of discounted cash flows. Any impairment would be measured as the difference between the asset group’s carrying amount and its estimated fair value.
GOODWILL AND INDEFINITE-LIVED INTANGIBLE ASSETS
The Company performs annual impairment tests on goodwill and intangible assets with indefinite lives in the fourth quarter of each fiscal year or when events occur or circumstances change that would, more likely than not, reduce the fair value of a reporting unit or an intangible asset with an indefinite life below its carrying value.
For purposes of testing goodwill for impairment, the Company allocates goodwill across its reporting units, which are considered the Company’s operating segments. For both goodwill and indefinite-lived intangible assets, which primarily consist of acquired trade names and trademarks, the Company may first assess qualitative factors to determine whether it is more likely than not that the fair value of a reporting unit or an intangible asset with an indefinite life is less than its carrying amount. If, after assessing the totality of events and circumstances, the Company determines it is more likely than not that the fair value of a reporting unit or indefinite-lived intangible asset is greater than its carrying amount, an impairment test is unnecessary.
If an impairment test is necessary, the Company will estimate the fair value of the related reporting unit or indefinite-lived intangible asset. If the carrying value of a reporting unit or indefinite-lived intangible asset exceeds its fair value, the goodwill of that reporting unit or indefinite-lived intangible asset is determined to be impaired and the Company will record an impairment charge equal to the excess of the carrying value over the related fair value.
There were no accumulated impairment losses as of May 31, 2023 and 2022. Additionally, the impact to Goodwill as a result of acquisitions and divestitures during fiscal 2023 and 2022, was not material.
OPERATING LEASES
The Company primarily leases retail store space, certain distribution and warehouse facilities, office space, equipment and other non-real estate assets. The Company determines if an arrangement is a lease at inception and begins recording lease activity at the commencement date, which is generally the date in which the Company takes possession of or controls the physical use of the asset. Lease components are not separated from non-lease components for real estate leases within the Company’s lease portfolio. Right-of-use (“ROU”) assets and lease liabilities are recognized based on the present value of lease payments over the lease term with lease expense recognized on a straight-line basis. The Company’s incremental borrowing rate is used to determine the present value of future lease payments unless the implicit rate is readily determinable.
Lease agreements may contain rent escalation clauses, renewal or termination options, rent holidays or certain landlord incentives, including tenant improvement allowances. ROU assets include amounts for scheduled rent increases and are reduced by the amount of lease incentives. The lease term includes the non-cancelable period of the lease and options to extend or terminate the lease when it is reasonably certain the Company will exercise those options. The Company does not record leases with an initial term of 12 months or less on the Consolidated Balance Sheets and recognizes related lease payments in the Consolidated Statements of Income on a straight-line basis over the lease term. Certain lease agreements include variable lease payments, which are based on a percent of retail sales over specified levels or adjust periodically for inflation as a result of changes in a published index, primarily the Consumer Price Index, and are expensed as incurred.
FAIR VALUE MEASUREMENTS
The Company measures certain financial assets and liabilities at fair value on a recurring basis, including derivatives, equity securities and available-for-sale debt securities. Fair value is the price the Company would receive to sell an asset or pay to transfer a liability in an orderly transaction with a market participant at the measurement date. The Company uses a three-level hierarchy that prioritizes fair value measurements based on the types of inputs used, as follows:
2023 FORM 10-K 64
Table of Contents
•Level 1: Quoted prices in active markets for identical assets or liabilities.
•Level 2: Inputs other than quoted prices that are observable for the asset or liability, either directly or indirectly; these include quoted prices for similar assets or liabilities in active markets and quoted prices for identical or similar assets or liabilities in markets that are not active.
•Level 3: Unobservable inputs with little or no market data available, which require the reporting entity to develop its own assumptions.
The Company’s assessment of the significance of a particular input to the fair value measurement in its entirety requires judgment and considers factors specific to the asset or liability. Financial assets and liabilities are classified in their entirety based on the most conservative level of input that is significant to the fair value measurement.
Pricing vendors are utilized for a majority of Level 1 and Level 2 investments. These vendors either provide a quoted market price in an active market or use observable inputs without applying significant adjustments in their pricing. Observable inputs include broker quotes, interest rates and yield curves observable at commonly quoted intervals, volatilities and credit risks. The fair value of derivative contracts is determined using observable market inputs such as the daily market foreign currency rates, forward pricing curves, currency volatilities, currency correlations and interest rates and considers nonperformance risk of the Company and its counterparties.
The Company’s fair value measurement process includes comparing fair values to another independent pricing vendor to ensure appropriate fair values are recorded.
Refer to Note 4 — Fair Value Measurements for additional information.
FOREIGN CURRENCY TRANSLATION AND FOREIGN CURRENCY TRANSACTIONS
Adjustments resulting from translating foreign functional currency financial statements into U.S. Dollars are included in the foreign currency translation adjustment, a component of Accumulated other comprehensive income (loss).
The Company’s global subsidiaries have various monetary assets and liabilities, primarily receivables and payables, which are denominated in currencies other than their functional currency. These balance sheet items are subject to remeasurement, the impact of which is recorded in Other (income) expense, net, within the Consolidated Statements of Income.
ACCOUNTING FOR DERIVATIVES AND HEDGING ACTIVITIES
The Company uses derivative financial instruments to reduce its exposure to changes in foreign currency exchange rates and interest rates. All derivatives are recorded at fair value on the Consolidated Balance Sheets and changes in the fair value of derivative financial instruments are either recognized in Accumulated other comprehensive income (loss), Long-term debt or Net income depending on the nature of the underlying exposure, whether the derivative is formally designated as a hedge and, if designated, the extent to which the hedge is effective. The Company classifies the cash flows at settlement from derivatives in the same category as the cash flows from the related hedged items. For undesignated hedges and designated cash flow hedges, this is primarily within the Cash provided by operations component of the Consolidated Statements of Cash Flows. For designated net investment hedges, this is within the Cash provided by investing activities component of the Consolidated Statements of Cash Flows. For the Company’s fair value hedges, which are interest rate swaps used to mitigate the change in fair value of its fixed-rate debt attributable to changes in interest rates, the related cash flows from periodic interest payments are reflected within the Cash provided by operations component of the Consolidated Statements of Cash Flows.
Refer to Note 12 — Risk Management and Derivatives for additional information on the Company’s risk management program and derivatives.
STOCK-BASED COMPENSATION
The Company accounts for stock-based compensation by estimating the fair value, net of estimated forfeitures, of equity awards and recognizing the related expense as Cost of sales or Operating overhead expense, as applicable, in the Consolidated Statements of Income on a straight-line basis over the vesting period. Substantially all awards vest ratably over four years of continued employment, with stock options expiring 10 years from the date of grant. Performance-based restricted stock units vest based on the Company’s achievement of certain performance criteria throughout the three-year performance period and continued employment through the vesting date. The fair value of options, stock appreciation rights and employees’ purchase rights under the employee stock purchase plans (“ESPPs”) is determined using the Black-Scholes option pricing model. The fair value of restricted stock and time-vesting restricted stock units is established by the market price on the date of grant. The fair value of performance-based restricted stock units is estimated as of the grant date using a Monte Carlo simulation.
Refer to Note 9 — Common Stock and Stock-Based Compensation for additional information on the Company’s stock-based compensation programs.
2023 FORM 10-K 65
Table of Contents
INCOME TAXES
The Company accounts for income taxes using the asset and liability method. This approach requires the recognition of deferred tax assets and liabilities for the expected future tax consequences of temporary differences between the carrying amounts and the tax basis of assets and liabilities. The Company records a valuation allowance to reduce deferred tax assets to the amount management believes is more likely than not to be realized. Realization of deferred tax assets is dependent on future taxable earnings and is therefore uncertain. At least quarterly, the Company assesses taxable income in prior carryback periods, the scheduled reversal of deferred tax liabilities, projected future taxable income and available tax planning strategies. The Company uses forecasts of taxable income and considers foreign tax credit utilization in making this assessment of realization, which are inherently uncertain and can result in significant variation between estimated and actual results. To the extent the Company believes that recovery is not likely, a valuation allowance is established against the net deferred tax asset, which increases the Company’s income tax expense in the period when such determination is made.
The Company recognizes a tax benefit from uncertain tax positions in the financial statements only when it is more likely than not the position will be sustained upon examination by relevant tax authorities. The Company recognizes interest and penalties related to income tax matters in Income tax expense.
Refer to Note 7 — Income Taxes for further discussion.
EARNINGS PER SHARE
Basic earnings per common share is calculated by dividing Net income by the weighted average number of common shares outstanding during the year. Diluted earnings per common share is calculated by adjusting weighted average outstanding shares, assuming conversion of all potentially dilutive stock options and awards.
Refer to Note 10 — Earnings Per Share for further discussion.
MANAGEMENT ESTIMATES
The preparation of financial statements in conformity with generally accepted accounting principles requires management to make estimates, including estimates relating to assumptions that affect the reported amounts of assets and liabilities and disclosure of contingent assets and liabilities at the date of financial statements and the reported amounts of revenues and expenses during the reporting period. Actual results could differ from these estimates. Additionally, the macroeconomic environment could remain volatile as the risk exists that worsening macroeconomic conditions could have a material, adverse impact on future revenue growth as well as overall profitability.
RECENTLY ISSUED ACCOUNTING STANDARDS
In September 2022, the Financial Accounting Standards Board (the “FASB”) issued Accounting Standards Update (“ASU”) ASU 2022-04, Liabilities — Supplier Finance Programs (Subtopic 405-50): Disclosure of Supplier Finance Program Obligations, which enhances transparency surrounding the use of supplier finance programs. The new guidance requires qualitative and quantitative disclosure sufficient to enable users of the financial statements to understand the nature, activity during the period, changes from period to period and potential magnitude of such programs. The amendments are effective for fiscal years beginning after December 15, 2022, including interim periods within those fiscal periods, except for the amendment on rollforward information, which is effective for fiscal years beginning after December 15, 2023. The Company will adopt the required guidance in the first quarter of fiscal 2024 and is currently evaluating the ASU to determine its impact on the Company’s disclosures.
2023 FORM 10-K 66
Table of Contents
| NOTE 2 — PROPERTY, PLANT AND EQUIPMENT | ||
Property, plant and equipment, net included the following:
| MAY 31, | ||||||||
| (Dollars in millions) | 2023 | 2022 | ||||||
| Land and improvements | $ | 326 | $ | 330 | ||||
| Buildings | 3,293 | 3,170 | ||||||
| Machinery and equipment | 3,083 | 2,870 | ||||||
| Internal-use software | 1,612 | 1,616 | ||||||
| Leasehold improvements | 1,876 | 1,712 | ||||||
| Construction in process | 525 | 399 | ||||||
| Total property, plant and equipment, gross | 10,715 | 10,097 | ||||||
| Less accumulated depreciation | 5,634 | 5,306 | ||||||
| TOTAL PROPERTY, PLANT AND EQUIPMENT, NET | $ | 5,081 | $ | 4,791 | ||||
Capitalized interest was not material for the fiscal years ended May 31, 2023, 2022 and 2021.
| NOTE 3 — ACCRUED LIABILITIES | ||
Accrued liabilities included the following:
| MAY 31, | ||||||||
| (Dollars in millions) | 2023 | 2022 | ||||||
| Compensation and benefits, excluding taxes | $ | 1,737 | $ | 1,297 | ||||
| Sales-related reserves | 994 | 1,015 | ||||||
| Endorsement compensation | 552 | 496 | ||||||
| Dividends payable | 529 | 485 | ||||||
| Allowance for expected loss on sale(1) | — | 397 | ||||||
| Other | 1,911 | 2,530 | ||||||
| Total Accrued Liabilities | $ | 5,723 | $ | 6,220 | ||||
(1)Refer to Note 18 — Acquisitions and Divestitures for additional information.
2023 FORM 10-K 67
Table of Contents
| NOTE 4 — FAIR VALUE MEASUREMENTS | ||
The following tables present information about the Company’s financial assets measured at fair value on a recurring basis as of May 31, 2023 and 2022, and indicate the level in the fair value hierarchy in which the Company classifies the fair value measurement. Refer to Note 1 — Summary of Significant Accounting Policies for additional detail regarding the Company’s fair value measurement methodology.
| MAY 31, 2023 | |||||||||||
| (Dollars in millions) | ASSETS AT FAIR VALUE | CASH AND EQUIVALENTS | SHORT-TERM INVESTMENTS | ||||||||
| Cash | $ | 1,767 | $ | 1,767 | $ | — | |||||
| Level 1: | |||||||||||
| U.S. Treasury securities | 2,655 | — | 2,655 | ||||||||
| Level 2: | |||||||||||
| Commercial paper and bonds | 543 | 15 | 528 | ||||||||
| Money market funds | 5,157 | 5,157 | — | ||||||||
| Time deposits | 507 | 502 | 5 | ||||||||
| U.S. Agency securities | 46 | — | 46 | ||||||||
| Total Level 2 | 6,253 | 5,674 | 579 | ||||||||
| TOTAL | $ | 10,675 | $ | 7,441 | $ | 3,234 | |||||
| MAY 31, 2022 | |||||||||||
| (Dollars in millions) | ASSETS AT FAIR VALUE | CASH AND EQUIVALENTS | SHORT-TERM INVESTMENTS | ||||||||
| Cash | $ | 839 | $ | 839 | $ | — | |||||
| Level 1: | |||||||||||
| U.S. Treasury securities | 3,801 | 8 | 3,793 | ||||||||
| Level 2: | |||||||||||
| Commercial paper and bonds | 660 | 37 | 623 | ||||||||
| Money market funds | 6,458 | 6,458 | — | ||||||||
| Time deposits | 1,237 | 1,232 | 5 | ||||||||
| U.S. Agency securities | 2 | — | 2 | ||||||||
| Total Level 2 | 8,357 | 7,727 | 630 | ||||||||
| TOTAL | $ | 12,997 | $ | 8,574 | $ | 4,423 | |||||
As of May 31, 2023, the Company held $2,563 million of available-for-sale debt securities with maturity dates within one year and $671 million with maturity dates over one year and less than five years in Short-term investments on the Consolidated Balance Sheets. The fair value of the Company’s available-for-sale debt securities approximates their amortized cost.
Included in Interest expense (income), net was interest income related to the Company’s investment portfolio of $297 million, $94 million and $34 million for the years ended May 31, 2023, 2022 and 2021, respectively.
The Company records the assets and liabilities of its derivative financial instruments on a gross basis on the Consolidated Balance Sheets. The Company’s derivative financial instruments are subject to master netting arrangements that allow for the offset of assets and liabilities in the event of default or early termination of the contract. Any amounts of cash collateral received related to these instruments associated with the Company’s credit-related contingent features are recorded in Cash and equivalents and Accrued liabilities, the latter of which would further offset against the Company’s derivative asset balance. Any amounts of cash collateral posted related to these instruments associated with the Company’s credit-related contingent features are recorded in Prepaid expenses and other current assets, which would further offset against the Company’s derivative liability balance. Cash collateral received or posted related to the Company’s credit-related contingent features is presented in the Cash provided by operations component of the Consolidated Statements of Cash Flows. The Company does not recognize amounts of non-cash collateral received, such as securities, on the Consolidated Balance Sheets. For further information related to credit risk, refer to Note 12 — Risk Management and Derivatives.
2023 FORM 10-K 68
Table of Contents
The following tables present information about the Company’s derivative assets and liabilities measured at fair value on a recurring basis and indicate the level in the fair value hierarchy in which the Company classifies the fair value measurement:
| MAY 31, 2023 | |||||||||||||||||||||||
| DERIVATIVE ASSETS | DERIVATIVE LIABILITIES | ||||||||||||||||||||||
| (Dollars in millions) | ASSETS AT FAIR VALUE | OTHER CURRENT ASSETS | OTHER LONG-TERM ASSETS | LIABILITIES AT FAIR VALUE | ACCRUED LIABILITIES | OTHER LONG-TERM LIABILITIES | |||||||||||||||||
| Level 2: | |||||||||||||||||||||||
| Foreign exchange forwards and options(1) | $ | 557 | $ | 493 | $ | 64 | $ | 180 | $ | 128 | $ | 52 | |||||||||||
(1)If the foreign exchange derivative instruments had been netted on the Consolidated Balance Sheets, the asset and liability positions each would have been reduced by $178 million as of May 31, 2023. As of that date, the Company received $36 million of cash collateral from various counterparties related to foreign exchange derivative instruments. No amount of collateral was posted on the derivative liability balance as of May 31, 2023.
| MAY 31, 2022 | |||||||||||||||||||||||
| DERIVATIVE ASSETS | DERIVATIVE LIABILITIES | ||||||||||||||||||||||
| (Dollars in millions) | ASSETS AT FAIR VALUE | OTHER CURRENT ASSETS | OTHER LONG-TERM ASSETS | LIABILITIES AT FAIR VALUE | ACCRUED LIABILITIES | OTHER LONG-TERM LIABILITIES | |||||||||||||||||
| Level 2: | |||||||||||||||||||||||
| Foreign exchange forwards and options and embedded derivatives(1) | $ | 880 | $ | 674 | $ | 206 | $ | 77 | $ | 66 | $ | 11 | |||||||||||
(1)If the foreign exchange derivative instruments had been netted on the Consolidated Balance Sheets, the asset and liability positions each would have been reduced by $76 million as of May 31, 2022. As of that date, the Company had received $486 million of cash collateral from various counterparties related to foreign exchange derivative instruments. No amount of collateral was posted on the Company’s derivative liability balance as of May 31, 2022.
For additional information related to the Company’s derivative financial instruments, refer to Note 12 — Risk Management and Derivatives. For fair value information regarding Notes payable and Long-term debt, refer to Note 5 — Short-Term Borrowings and Credit Lines and Note 6 — Long-Term Debt, respectively.
The carrying amounts of other current financial assets and other current financial liabilities approximate fair value.
NON-RECURRING FAIR VALUE MEASUREMENTS
As further discussed in Note 18 — Acquisitions and Divestitures, the Company met the criteria to recognize the related assets and liabilities of its Argentina, Chile and Uruguay entities as held-for-sale as of May 31, 2022. This required the Company to remeasure the disposal groups at fair value, less costs to sell, which is considered a Level 3 fair value measurement and was based on each transaction’s estimated consideration.
All other assets or liabilities required to be measured at fair value on a non-recurring basis as of May 31, 2023 and 2022 were immaterial.
2023 FORM 10-K 69
Table of Contents
| NOTE 5 — SHORT-TERM BORROWINGS AND CREDIT LINES | ||
The carrying amounts reflected in the Consolidated Balance Sheets for Notes payable approximate fair value.
On March 11, 2022, the Company entered into a five-year committed credit facility agreement with a syndicate of banks which provides for up to $2 billion of borrowings, with the option to increase borrowings up to $3 billion in total with lender approval. The facility matures on March 11, 2027, with options to extend the maturity date up to an additional two years. This facility replaces the prior $2 billion five-year credit facility agreement entered into on August 16, 2019, which would have matured on August 16, 2024. Based on the Company’s current long-term senior unsecured debt ratings of AA- and A1 from Standard and Poor’s Corporation and Moody’s Investor Services, respectively, the interest rate charged on any outstanding borrowings would be the prevailing Term SOFR for the applicable interest period plus 0.60%. The facility fee is 0.04% of the total undrawn commitment.
On March 10, 2023, the Company entered into a 364-day committed credit facility agreement with a syndicate of banks, which provides for up to $1 billion of borrowings, with an option to increase borrowings up to $1.5 billion in total with lender approval. The facility matures on March 8, 2024, with an option to extend the maturity date an additional 364 days. This facility replaces the prior $1 billion 364-day credit facility agreement entered into on March 11, 2022, which matured on March 10, 2023. Based on the Company’s current long-term senior unsecured debt ratings of AA- and A1 from Standard and Poor’s Corporation and Moody’s Investor Services, respectively, the interest rate charged on any outstanding borrowings would be the prevailing Term Secured Overnight Financing Rate (“Term SOFR”) for the applicable interest period plus 0.60%. The facility fee is 0.02% of the total undrawn commitment.
As of and for the periods ended May 31, 2023 and 2022, no amounts were outstanding under any of the Company’s committed credit facilities.
2023 FORM 10-K 70
Table of Contents
| NOTE 6 — LONG-TERM DEBT | ||
Long-term debt, net of unamortized premiums, discounts and debt issuance costs, comprises the following:
| BOOK VALUE OUTSTANDING AS OF MAY 31, | |||||||||||||||||
| Scheduled Maturity (Dollars in millions) | ORIGINAL PRINCIPAL | INTEREST RATE | INTEREST PAYMENTS | 2023 | 2022 | ||||||||||||
| Corporate Term Debt:(1)(2) | |||||||||||||||||
| May 1, 2023 | $ | 500 | 2.25 | % | Semi-Annually | $ | — | $ | 500 | ||||||||
| March 27, 2025 | 1,000 | 2.40 | % | Semi-Annually | 998 | 996 | |||||||||||
| November 1, 2026 | 1,000 | 2.38 | % | Semi-Annually | 997 | 997 | |||||||||||
| March 27, 2027 | 1,000 | 2.75 | % | Semi-Annually | 997 | 996 | |||||||||||
| March 27, 2030 | 1,500 | 2.85 | % | Semi-Annually | 1,492 | 1,491 | |||||||||||
| March 27, 2040 | 1,000 | 3.25 | % | Semi-Annually | 987 | 986 | |||||||||||
| May 1, 2043 | 500 | 3.63 | % | Semi-Annually | 496 | 496 | |||||||||||
| November 1, 2045 | 1,000 | 3.88 | % | Semi-Annually | 986 | 985 | |||||||||||
| November 1, 2046 | 500 | 3.38 | % | Semi-Annually | 492 | 492 | |||||||||||
| March 27, 2050 | 1,500 | 3.38 | % | Semi-Annually | 1,482 | 1,481 | |||||||||||
| Total | 8,927 | 9,420 | |||||||||||||||
| Less Current Portion of Long-Term Debt | — | 500 | |||||||||||||||
| TOTAL LONG-TERM DEBT | $ | 8,927 | $ | 8,920 | |||||||||||||
(1)These senior unsecured obligations rank equally with the Company’s other unsecured and unsubordinated indebtedness.
(2)The bonds are redeemable at the Company’s option at a price equal to the greater of (i) 100% of the aggregate principal amount of the notes to be redeemed or (ii) the sum of the present values of the remaining scheduled payments, plus in each case, accrued and unpaid interest. However, the bonds also feature a par call provision, which allows for the bonds to be redeemed at a price equal to 100% of the aggregate principal amount of the notes being redeemed, plus accrued and unpaid interest on or after the Par Call Date, as defined in the respective notes.
The scheduled maturity of Long-term debt in each of the years ending May 31, 2024 through 2028, are $0 million, $1,000 million, $0 million, $2,000 million and $0 million, respectively, at face value.
The Company’s Long-term debt is recorded at adjusted cost, net of unamortized premiums, discounts and debt issuance costs. The fair value of long-term debt is estimated based upon quoted prices for similar instruments or quoted prices for identical instruments in inactive markets (Level 2). The fair value of the Company’s Long-term debt, including the current portion, was approximately $7,889 million and $8,933 million as of May 31, 2023 and 2022, respectively.
2023 FORM 10-K 71
Table of Contents
| NOTE 7 — INCOME TAXES | ||
Income before income taxes is as follows:
| YEAR ENDED MAY 31, | |||||||||||
| (Dollars in millions) | 2023 | 2022 | 2021 | ||||||||
| Income before income taxes: | |||||||||||
| United States | $ | 4,663 | $ | 6,020 | $ | 5,723 | |||||
| Foreign | 1,538 | 631 | 938 | ||||||||
| TOTAL INCOME BEFORE INCOME TAXES | $ | 6,201 | $ | 6,651 | $ | 6,661 | |||||
The provision for income taxes is as follows:
| YEAR ENDED MAY 31, | |||||||||||
| (Dollars in millions) | 2023 | 2022 | 2021 | ||||||||
| Current: | |||||||||||
| United States | |||||||||||
| Federal | $ | 430 | $ | 231 | $ | 328 | |||||
| State | 184 | 98 | 134 | ||||||||
| Foreign | 634 | 926 | 857 | ||||||||
| Total Current | 1,248 | 1,255 | 1,319 | ||||||||
| Deferred: | |||||||||||
| United States | |||||||||||
| Federal | (162) | (522) | (371) | ||||||||
| State | (25) | (16) | (34) | ||||||||
| Foreign | 70 | (112) | 20 | ||||||||
| Total Deferred | (117) | (650) | (385) | ||||||||
| TOTAL INCOME TAX EXPENSE | $ | 1,131 | $ | 605 | $ | 934 | |||||
A reconciliation from the U.S. statutory federal income tax rate to the effective income tax rate is as follows:
| YEAR ENDED MAY 31, | |||||||||||
| 2023 | 2022 | 2021 | |||||||||
| Federal income tax rate | 21.0 | % | 21.0 | % | 21.0 | % | |||||
| State taxes, net of federal benefit | 1.5 | % | 1.4 | % | 1.3 | % | |||||
| Foreign earnings | 1.7 | % | -1.8 | % | 0.2 | % | |||||
| Subpart F deferred tax benefit | 0.0 | % | -4.7 | % | 0.0 | % | |||||
| Foreign-derived intangible income benefit | -6.1 | % | -4.1 | % | -3.7 | % | |||||
| Excess tax benefits from stock-based compensation | -1.1 | % | -4.9 | % | -4.5 | % | |||||
| Income tax audits and contingency reserves | 1.0 | % | 1.5 | % | 1.5 | % | |||||
| U.S. research and development tax credit | -1.2 | % | -1.0 | % | -0.9 | % | |||||
| Other, net | 1.4 | % | 1.7 | % | -0.9 | % | |||||
| EFFECTIVE INCOME TAX RATE | 18.2 | % | 9.1 | % | 14.0 | % | |||||
On December 22, 2017, the U.S. enacted the Tax Cuts and Jobs Act (the “Tax Act”), which significantly changed U.S. tax law and included a provision to tax global intangible low-taxed income (“GILTI”) of foreign subsidiaries. The Company recognizes taxes due under the GILTI provision as a current period expense.
The effective tax rate for the fiscal year ended May 31, 2023 was higher than the effective tax rate for the fiscal year ended May 31, 2022. The increase was primarily due to decreased benefits from stock-based compensation and the prior year recognition of a non-cash, one-time benefit related to the onshoring of the Company’s non-U.S. intangible property. During the fourth quarter of fiscal 2022, the Company onshored certain non-U.S. intangible property ownership rights and implemented changes in the Company’s legal entity structure. The tax restructuring increases the possibility that foreign earnings in future periods will be subject to tax in the U.S. due to Subpart F of the Internal Revenue Code. The Company recognized a deferred tax asset and corresponding non-cash deferred income tax benefit of 4.7%, to establish the deferred tax deduction that is expected to reduce taxable income in future periods.
2023 FORM 10-K 72
Table of Contents
The effective tax rate for the fiscal year ended May 31, 2022 was lower than the effective tax rate for the fiscal year ended May 31, 2021. The decrease was primarily due to a shift in the Company’s earnings mix and recognition of a non-cash, one-time benefit related to the onshoring of the Company’s non-U.S. intangible property.
Deferred tax assets and liabilities comprise the following as of:
| MAY 31, | ||||||||
| (Dollars in millions) | 2023 | 2022 | ||||||
| Deferred tax assets: | ||||||||
| Inventories(1) | $ | 79 | $ | 136 | ||||
| Sales return reserves(1) | 89 | 109 | ||||||
| Deferred compensation(1) | 321 | 313 | ||||||
| Stock-based compensation | 261 | 195 | ||||||
| Reserves and accrued liabilities(1) | 144 | 145 | ||||||
| Operating lease liabilities | 511 | 508 | ||||||
| Intangibles | 255 | 275 | ||||||
| Capitalized research and development expenditures | 548 | 353 | ||||||
| Net operating loss carry-forwards | 15 | 8 | ||||||
| Subpart F deferred tax | 374 | 313 | ||||||
| Foreign tax credit carry-forward | — | 103 | ||||||
| Other(1) | 183 | 148 | ||||||
| Total deferred tax assets | 2,780 | 2,606 | ||||||
| Valuation allowance | (22) | (19) | ||||||
| Total deferred tax assets after valuation allowance | 2,758 | 2,587 | ||||||
| Deferred tax liabilities: | ||||||||
| Foreign withholding tax on undistributed earnings of foreign subsidiaries | (186) | (146) | ||||||
| Property, plant and equipment(1) | (276) | (247) | ||||||
| Right-of-use assets | (441) | (437) | ||||||
| Other(1) | (56) | (92) | ||||||
| Total deferred tax liabilities | (959) | (922) | ||||||
| NET DEFERRED TAX ASSET (2) | $ | 1,799 | $ | 1,665 | ||||
(1)The above amounts exclude deferred taxes held-for-sale as of May 31, 2022. See Note 18 — Acquisitions and Divestitures for additional information.
(2)Of the total $1,799 million net deferred tax asset for the period ended May 31, 2023, $2,026 million was included within Deferred income taxes and other assets and $(227) million was included within Deferred income taxes and other liabilities on the Consolidated Balance Sheets. Of the total $1,665 million net deferred tax asset for the period ended May 31, 2022, $1,891 million was included within Deferred income taxes and other assets and $(226) million was included within Deferred income taxes and other liabilities on the Consolidated Balance Sheets.
The following is a reconciliation of the changes in the gross balance of unrecognized tax benefits as of:
| MAY 31, | |||||||||||
| (Dollars in millions) | 2023 | 2022 | 2021 | ||||||||
| Unrecognized tax benefits, beginning of the period | $ | 848 | $ | 896 | $ | 771 | |||||
| Gross increases related to prior period tax positions | 95 | 71 | 77 | ||||||||
| Gross decreases related to prior period tax positions | (17) | (145) | (22) | ||||||||
| Gross increases related to current period tax positions | 50 | 62 | 59 | ||||||||
| Settlements | (18) | (17) | (5) | ||||||||
| Lapse of statute of limitations | (7) | (10) | (6) | ||||||||
| Changes due to currency translation | (15) | (9) | 22 | ||||||||
| UNRECOGNIZED TAX BENEFITS, END OF THE PERIOD | $ | 936 | $ | 848 | $ | 896 | |||||
As of May 31, 2023, total gross unrecognized tax benefits, excluding related interest and penalties, were $936 million, of which $651 million would affect the Company’s effective tax rate if recognized in future periods. The majority of the total gross unrecognized tax benefits are long-term in nature and included within Deferred income taxes and other liabilities on the Consolidated Balance Sheets.
2023 FORM 10-K 73
Table of Contents
The Company recognizes interest and penalties related to income tax matters in Income tax expense. The liability for payment of interest and penalties increased by $20 million during the fiscal year ended May 31, 2023, increased by $45 million during the fiscal year ended May 31, 2022, and increased by $45 million during the fiscal year ended May 31, 2021. As of May 31, 2023 and 2022, accrued interest and penalties related to uncertain tax positions were $268 million and $248 million, respectively (excluding federal benefit) and were included within Deferred income taxes and other liabilities on the Consolidated Balance Sheets.
As of May 31, 2023 and 2022, long-term income taxes payable were $373 million and $535 million, respectively, and were included within Deferred income taxes and other liabilities on the Consolidated Balance Sheets.
The Company is subject to taxation in the U.S., as well as various state and foreign jurisdictions. The Company is currently under audit by the U.S. IRS for fiscal years 2017 through 2019. The Company has closed all U.S. federal income tax matters through fiscal 2016, with the exception of certain transfer pricing adjustments. Tax years after 2011 remain open in certain major foreign jurisdictions. Although the timing of resolution of audits is not certain, the Company evaluates all domestic and foreign audit issues in the aggregate, along with the expiration of applicable statutes of limitations, and estimates that it is reasonably possible the total gross unrecognized tax benefits could decrease by up to $50 million within the next 12 months. In January 2019, the European Commission opened a formal investigation to examine whether the Netherlands has breached State Aid rules when granting certain tax rulings to the Company. The Company believes the investigation is without merit. If this matter is adversely resolved, the Netherlands may be required to assess additional amounts with respect to prior periods, and the Company’s income taxes related to prior periods in the Netherlands could increase.
A portion of the Company’s foreign operations benefit from a tax holiday, which is set to expire in 2031. This tax holiday may be extended when certain conditions are met or may be terminated early if certain conditions are not met. The tax benefit attributable to this tax holiday, before taking into consideration other U.S. indirect tax provisions, was $263 million, $221 million and $238 million for the fiscal years ended May 31, 2023, 2022 and 2021, respectively. The benefit of the tax holiday on diluted earnings per common share was $0.17, $0.14 and $0.15 for the fiscal years ended May 31, 2023, 2022 and 2021, respectively.
Deferred tax assets as of May 31, 2023 and 2022, were reduced by a valuation allowance. For the fiscal year ended May 31, 2023, a valuation allowance was provided for U.S. capital loss carryforwards and on tax benefits generated by certain entities with operating losses. For the fiscal year ended May 31, 2022, a valuation allowance was provided for U.S. capital loss carryforwards and on tax benefits generated by certain entities with operating losses. There was a $3 million net increase in the valuation allowance for the fiscal year ended May 31, 2023, compared to a $7 million net increase for the fiscal year ended May 31, 2022, and $14 million net decrease for the fiscal year ended May 31, 2021.
The Company has available domestic and foreign loss carry-forwards of $61 million as of May 31, 2023. If not utilized, $33 million of losses will expire in the periods between fiscal 2028 and 2043.
| NOTE 8 — REDEEMABLE PREFERRED STOCK | ||
Sojitz America is the sole owner of the Company’s authorized redeemable preferred stock, $1 par value, which is redeemable at the option of Sojitz America or the Company at par value aggregating $0.3 million. A cumulative dividend of $0.10 per share is payable annually on May 31, and no dividends may be declared or paid on the common stock of the Company unless dividends on the redeemable preferred stock have been declared and paid in full. There have been no changes in the redeemable preferred stock in the fiscal years ended May 31, 2023, 2022 and 2021. As the holder of the redeemable preferred stock, Sojitz America does not have general voting rights but does have the right to vote as a separate class on the sale of all or substantially all of the assets of the Company and its subsidiaries; on merger, consolidation, liquidation or dissolution of the Company; or on the sale or assignment of the NIKE trademark for athletic footwear sold in the United States. The redeemable preferred stock has been fully issued to Sojitz America and is not blank check preferred stock. The Company’s articles of incorporation do not permit the issuance of additional preferred stock.
| NOTE 9 — COMMON STOCK AND STOCK-BASED COMPENSATION | ||
COMMON STOCK
The authorized number of shares of Class A Common Stock, no par value, and Class B Common Stock, no par value, are 400 million and 2,400 million, respectively. Each share of Class A Common Stock is convertible into one share of Class B Common Stock. Voting rights of Class B Common Stock are limited in certain circumstances with respect to the election of directors. There are no differences in the dividend and liquidation preferences or participation rights of the holders of Class A and Class B Common Stock. From time to time, the Company’s Board of Directors authorizes share repurchase programs for the repurchase of Class B Common Stock. The value of repurchased shares is deducted from Total shareholders’ equity through allocation to Capital in excess of stated value and Retained earnings.
2023 FORM 10-K 74
Table of Contents
STOCK-BASED COMPENSATION
The NIKE, Inc. Stock Incentive Plan (the “Stock Incentive Plan”) provides for the issuance of up to 798 million previously unissued shares of Class B Common Stock in connection with equity awards granted under the Stock Incentive Plan. The Stock Incentive Plan authorizes the grant of non-statutory stock options, incentive stock options, stock appreciation rights, and stock awards, including restricted stock and restricted stock units. Restricted stock units include both time-vesting restricted stock units (“RSUs”) as well as performance-based restricted stock units (“PSUs”). A committee of the Board of Directors administers the Stock Incentive Plan and has the authority to determine the employees to whom awards will be made, the amount of the awards and the other terms and conditions of the awards. The Company generally grants stock options, restricted stock and restricted stock units on an annual basis. The exercise price for stock options and stock appreciation rights may not be less than the fair market value of the underlying shares on the date of grant. Substantially all awards under the Stock Incentive Plan vest ratably over 4 years of continued employment, with stock options expiring 10 years from the date of grant.
The following table summarizes the Company’s total stock-based compensation expense recognized in Cost of sales or Operating overhead expense, as applicable:
| YEAR ENDED MAY 31, | |||||||||||
| (Dollars in millions) | 2023 | 2022 | 2021 | ||||||||
| Stock options(1) | $ | 311 | $ | 297 | $ | 323 | |||||
| ESPPs | 72 | 60 | 63 | ||||||||
| Restricted stock and restricted stock units(1)(2) | 372 | 281 | 225 | ||||||||
| TOTAL STOCK-BASED COMPENSATION EXPENSE | $ | 755 | $ | 638 | $ | 611 | |||||
(1)Expense for stock options includes the expense associated with stock appreciation rights. Accelerated stock option expense is primarily recorded for employees meeting certain retirement eligibility requirements and was $64 million, $57 million and $67 million for the fiscal years ended May 31, 2023, 2022 and 2021, respectively. During fiscal 2021, an immaterial amount of accelerated stock option and restricted stock unit expense was also recorded for certain employees impacted by the Company’s organizational realignment. For more information, see Note 19 — Restructuring.
(2)For the fiscal years ended May 31, 2023 and 2022, expense for restricted stock units includes an immaterial amount of expense for PSUs.
The income tax benefit related to stock-based compensation expense was $71 million, $327 million and $297 million for the fiscal years ended May 31, 2023, 2022 and 2021, respectively, and reported within Income tax expense.
STOCK OPTIONS
The weighted average fair value per share of stock options granted during the years ended May 31, 2023, 2022 and 2021, computed as of the grant date using the Black-Scholes pricing model, was $31.31, $37.53 and $26.75, respectively. The weighted average assumptions used to estimate these fair values were as follows:
| YEAR ENDED MAY 31, | |||||||||||
| 2023 | 2022 | 2021 | |||||||||
| Dividend yield | 0.9 | % | 0.8 | % | 0.9 | % | |||||
| Expected volatility | 27.1 | % | 24.9 | % | 27.3 | % | |||||
| Weighted average expected life (in years) | 5.8 | 5.8 | 6.0 | ||||||||
| Risk-free interest rate | 3.3 | % | 0.9 | % | 0.4 | % | |||||
Expected volatilities are based on an analysis of the historical volatility of the Company’s common stock, the implied volatility in market traded options on the Company’s common stock with a term greater than one year, as well as other factors. The weighted average expected life of options is based on an analysis of historical and expected future exercise patterns. The interest rate is based on the U.S. Treasury (constant maturity) risk-free rate in effect at the date of grant for periods corresponding with the expected term of the options.
2023 FORM 10-K 75
Table of Contents
The following summarizes the stock option transactions under the plan discussed above:
| SHARES(1) | WEIGHTED AVERAGE OPTION PRICE | |||||||
| (In millions) | ||||||||
| Options outstanding as of May 31, 2022 | 68.0 | $ | 88.66 | |||||
| Exercised | (7.5) | 57.11 | ||||||
| Forfeited | (1.5) | 122.93 | ||||||
| Granted | 12.0 | 107.44 | ||||||
| Options outstanding as of May 31, 2023 | 71.0 | $ | 94.40 | |||||
(1)Includes stock appreciation rights transactions.
Options exercisable as of May 31, 2023 were 44.7 million and had a weighted average option price of $79.95 per share. The aggregate intrinsic value for options outstanding and exercisable as of May 31, 2023 was $1,380 million and $1,307 million, respectively. The total intrinsic value of the options exercised during the years ended May 31, 2023, 2022 and 2021 was $438 million, $1,742 million and $1,571 million, respectively. The intrinsic value is the amount by which the market value of the underlying stock exceeds the exercise price of the options. The weighted average contractual life remaining for options outstanding and options exercisable as of May 31, 2023 was 5.9 years and 4.5 years, respectively. As of May 31, 2023, the Company had $425 million of unrecognized compensation costs from stock options, net of estimated forfeitures, to be recognized in Cost of sales or Operating overhead expense, as applicable, over a weighted average remaining period of 2.5 years.
EMPLOYEE STOCK PURCHASE PLANS
In addition to the Stock Incentive Plan, the Company gives employees the right to purchase shares at a discount from the market price under ESPPs. Subject to the annual statutory limit, employees are eligible to participate through payroll deductions of up to 10% of their compensation. At the end of each six-month offering period, shares are purchased by the participants at 85% of the lower of the fair market value at the beginning or the end of the offering period. Employees purchased 3.0 million, 2.0 million and 2.5 million shares during each of the fiscal years ended May 31, 2023, 2022 and 2021, respectively.
RESTRICTED STOCK AND RESTRICTED STOCK UNITS
Recipients of restricted stock are entitled to cash dividends and to vote their respective shares throughout the period of restriction. Recipients of restricted stock units, which includes RSUs and PSUs, are entitled to dividend equivalent cash payments upon vesting. The number of shares of restricted stock and restricted stock units vested includes shares of common stock withheld by the Company on behalf of employees to satisfy the minimum statutory tax withholding requirements.
The following summarizes the restricted stock and restricted stock units transactions under the plan discussed above:
| SHARES(1) | WEIGHTED AVERAGE GRANT DATE FAIR VALUE | ||||||||||
| (In millions) | |||||||||||
| Nonvested as of May 31, 2022 | 6.7 | $ | 130.88 | ||||||||
| Vested | (2.2) | 114.85 | |||||||||
| Forfeited | (0.7) | 131.10 | |||||||||
| Granted | 4.5 | 115.56 | |||||||||
| Nonvested as of May 31, 2023 | 8.3 | $ | 126.97 | ||||||||
(1) Includes an immaterial amount of PSU transactions
The weighted average fair value per share of restricted stock and restricted stock units granted for the fiscal years ended May 31, 2023, 2022 and 2021, computed as of the grant date, was $115.56, $168.04 and $113.84, respectively. During the fiscal years ended May 31, 2023, 2022 and 2021, the aggregate fair value of vested restricted stock and restricted stock units was $250 million, $354 million and $310 million, respectively, computed as of the date of vesting.
As of May 31, 2023, the Company had $649 million of unrecognized compensation costs from restricted stock and restricted stock units, net of estimated forfeitures, to be recognized in Cost of sales or Operating overhead expense, as applicable, over a weighted average remaining period of 2.3 years.
2023 FORM 10-K 76
Table of Contents
| NOTE 10 — EARNINGS PER SHARE | ||
The following is a reconciliation from basic earnings per common share to diluted earnings per common share. The computations of diluted earnings per common share excluded restricted stock, restricted stock units and options, including shares under ESPPs, to purchase an estimated additional 31.7 million, 9.4 million and 11.3 million shares of common stock outstanding for the fiscal years ended May 31, 2023, 2022 and 2021, respectively, because the awards were assumed to be anti-dilutive.
| YEAR ENDED MAY 31, | |||||||||||
| (In millions, except per share data) | 2023 | 2022 | 2021 | ||||||||
| Net income available to common stockholders | $ | 5,070 | $ | 6,046 | $ | 5,727 | |||||
| Determination of shares: | |||||||||||
| Weighted average common shares outstanding | 1,551.6 | 1,578.8 | 1,573.0 | ||||||||
| Assumed conversion of dilutive stock options and awards | 18.2 | 32.0 | 36.4 | ||||||||
| DILUTED WEIGHTED AVERAGE COMMON SHARES OUTSTANDING | 1,569.8 | 1,610.8 | 1,609.4 | ||||||||
| Earnings per common share: | |||||||||||
| Basic | $ | 3.27 | $ | 3.83 | $ | 3.64 | |||||
| Diluted | $ | 3.23 | $ | 3.75 | $ | 3.56 | |||||
| NOTE 11 — BENEFIT PLANS | ||
The Company has a qualified 401(k) Savings and Profit Sharing Plan, in which all U.S. employees are able to participate. The Company matches a portion of employee contributions to the savings plan. Company contributions to the savings plan were $136 million, $126 million and $110 million and included in Cost of sales or Operating overhead expense, as applicable, for the fiscal years ended May 31, 2023, 2022 and 2021, respectively.
The Company also has a Long-Term Incentive Plan (“LTIP”) adopted by the Board of Directors and approved by shareholders in September 1997, which has been amended from time to time. The Company recognized an immaterial amount of Operating overhead expense related to cash awards under the LTIP during the years ended May 31, 2023, 2022 and 2021. During the fiscal years ended May 31, 2023 and 2022, under the Stock Incentive Plan, the Company granted PSUs which replaced cash-based long-term incentive awards historically granted under the Company’s LTIP. Refer to Note 9 — Common Stock and Stock-Based Compensation for further information related to PSUs.
The Company allows certain highly compensated employees and non-employee directors of the Company to defer compensation under a nonqualified deferred compensation plan. A rabbi trust was established to fund the Company’s nonqualified deferred compensation plan obligation. The assets in the rabbi trust of approximately $875 million and $876 million as of May 31, 2023 and 2022, respectively, primarily consist of company owned life insurance policies recorded at their cash surrender value and are classified in Deferred income taxes and other assets on the Consolidated Balance Sheets. Deferred compensation plan liabilities were $897 million and $890 million as of May 31, 2023 and 2022, respectively, and primarily classified in Deferred income taxes and other liabilities on the Consolidated Balance Sheets.
The Company has pension plans in various countries worldwide. The pension plans are only available to local employees and are generally government mandated. The liability related to the unfunded pension liabilities of the plans was $29 million and $30 million as of May 31, 2023 and 2022, respectively, and primarily classified as non-current in Deferred income taxes and other liabilities on the Consolidated Balance Sheets.
| NOTE 12 — RISK MANAGEMENT AND DERIVATIVES | ||
The Company is exposed to global market risks, including the effect of changes in foreign currency exchange rates and interest rates, and uses derivatives to manage financial exposures that occur in the normal course of business. The Company does not hold or issue derivatives for trading or speculative purposes.
The Company may elect to designate certain derivatives as hedging instruments under U.S. GAAP. The Company formally documents all relationships between designated hedging instruments and hedged items, as well as its risk management objectives and strategies for undertaking hedge transactions. This process includes linking all derivatives designated as hedges to either recognized assets or liabilities or forecasted transactions and assessing, both at inception and on an ongoing basis, the effectiveness of the hedging relationships.
2023 FORM 10-K 77
Table of Contents
The majority of derivatives outstanding as of May 31, 2023, are designated as foreign currency cash flow hedges, primarily for Euro/U.S. Dollar, British Pound/Euro, Chinese Yuan/U.S. Dollar and Japanese Yen/U.S. Dollar currency pairs. All derivatives are recognized on the Consolidated Balance Sheets at fair value and classified based on the instrument’s maturity date.
The following tables present the fair values of derivative instruments included within the Consolidated Balance Sheets:
| DERIVATIVE ASSETS | ||||||||||||||
| BALANCE SHEET LOCATION | MAY 31, | |||||||||||||
| (Dollars in millions) | 2023 | 2022 | ||||||||||||
| Derivatives formally designated as hedging instruments: | ||||||||||||||
| Foreign exchange forwards and options | Prepaid expenses and other current assets | $ | 480 | $ | 639 | |||||||||
| Foreign exchange forwards and options | Deferred income taxes and other assets | 64 | 206 | |||||||||||
| Total derivatives formally designated as hedging instruments | 544 | 845 | ||||||||||||
| Derivatives not designated as hedging instruments: | ||||||||||||||
| Foreign exchange forwards and options and embedded derivatives | Prepaid expenses and other current assets | 13 | 35 | |||||||||||
| Total derivatives not designated as hedging instruments | 13 | 35 | ||||||||||||
| TOTAL DERIVATIVE ASSETS | $ | 557 | $ | 880 | ||||||||||
| DERIVATIVE LIABILITIES | ||||||||||||||
| BALANCE SHEET LOCATION | MAY 31, | |||||||||||||
| (Dollars in millions) | 2023 | 2022 | ||||||||||||
| Derivatives formally designated as hedging instruments: | ||||||||||||||
| Foreign exchange forwards and options | Accrued liabilities | $ | 93 | $ | 37 | |||||||||
| Foreign exchange forwards and options | Deferred income taxes and other liabilities | 52 | 11 | |||||||||||
| Total derivatives formally designated as hedging instruments | 145 | 48 | ||||||||||||
| Derivatives not designated as hedging instruments: | ||||||||||||||
| Foreign exchange forwards and options and embedded derivatives | Accrued liabilities | 35 | 29 | |||||||||||
| Total derivatives not designated as hedging instruments | 35 | 29 | ||||||||||||
| TOTAL DERIVATIVE LIABILITIES | $ | 180 | $ | 77 | ||||||||||
The following table presents the amounts in the Consolidated Statements of Income in which the effects of cash flow hedges are recorded and the effects of cash flow hedge activity on these line items for the fiscal years ended May 31, 2023, 2022 and 2021:
| YEAR ENDED MAY 31, | ||||||||||||||||||||||||||
| 2023 | 2022 | 2021 | ||||||||||||||||||||||||
| (Dollars in millions) | TOTAL | AMOUNT OF GAIN (LOSS) ON CASH FLOW HEDGE ACTIVITY | TOTAL | AMOUNT OF GAIN (LOSS) ON CASH FLOW HEDGE ACTIVITY | TOTAL | AMOUNT OF GAIN (LOSS) ON CASH FLOW HEDGE ACTIVITY | ||||||||||||||||||||
| Revenues | $ | 51,217 | $ | 26 | $ | 46,710 | $ | (82) | $ | 44,538 | $ | 45 | ||||||||||||||
| Cost of sales | 28,925 | 581 | 25,231 | (23) | 24,576 | 51 | ||||||||||||||||||||
| Demand creation expense | 4,060 | (5) | 3,850 | 1 | 3,114 | 3 | ||||||||||||||||||||
| Other (income) expense, net | (280) | 338 | (181) | 130 | 14 | (47) | ||||||||||||||||||||
| Interest expense (income), net | (6) | (8) | 205 | (7) | 262 | (7) | ||||||||||||||||||||
2023 FORM 10-K 78
Table of Contents
The following tables present the amounts affecting the Consolidated Statements of Income for the years ended May 31, 2023, 2022 and 2021:
(Dollars in millions) | AMOUNT OF GAIN (LOSS) RECOGNIZED IN OTHER COMPREHENSIVE INCOME (LOSS) ON DERIVATIVES(1) | AMOUNT OF GAIN (LOSS) RECLASSIFIED FROM ACCUMULATED OTHER COMPREHENSIVE INCOME (LOSS) INTO INCOME(1) | |||||||||||||||||||||||||||
| YEAR ENDED MAY 31, | LOCATION OF GAIN (LOSS) RECLASSIFIED FROM ACCUMULATED OTHER COMPREHENSIVE INCOME (LOSS) INTO INCOME | YEAR ENDED MAY 31, | |||||||||||||||||||||||||||
| 2023 | 2022 | 2021 | 2023 | 2022 | 2021 | ||||||||||||||||||||||||
| Derivatives designated as cash flow hedges: | |||||||||||||||||||||||||||||
| Foreign exchange forwards and options | $ | 16 | $ | (39) | $ | (61) | Revenues | $ | 26 | $ | (82) | $ | 45 | ||||||||||||||||
| Foreign exchange forwards and options | 305 | 889 | (563) | Cost of sales | 581 | (23) | 51 | ||||||||||||||||||||||
| Foreign exchange forwards and options | (1) | (6) | 5 | Demand creation expense | (5) | 1 | 3 | ||||||||||||||||||||||
| Foreign exchange forwards and options | 207 | 492 | (163) | Other (income) expense, net | 338 | 130 | (47) | ||||||||||||||||||||||
| Interest rate swaps(2) | — | — | — | Interest expense (income), net | (8) | (7) | (7) | ||||||||||||||||||||||
| Total designated cash flow hedges | $ | 527 | $ | 1,336 | $ | (782) | $ | 932 | $ | 19 | $ | 45 | |||||||||||||||||
(1)For the fiscal years ended May 31, 2023, 2022, and 2021, the amounts recorded in Other (income) expense, net as a result of the discontinuance of cash flow hedges because the forecasted transactions were no longer probable of occurring were immaterial.
(2)Gains and losses associated with terminated interest rate swaps, which were previously designated as cash flow hedges and recorded in Accumulated other comprehensive income (loss), will be released through Interest expense (income), net over the term of the issued debt.
| AMOUNT OF GAIN (LOSS) RECOGNIZED IN INCOME ON DERIVATIVES | LOCATION OF GAIN (LOSS) RECOGNIZED IN INCOME ON DERIVATIVES | ||||||||||||||||
| YEAR ENDED MAY 31, | |||||||||||||||||
| (Dollars in millions) | 2023 | 2022 | 2021 | ||||||||||||||
| Derivatives designated as hedging instruments: | |||||||||||||||||
| Foreign exchange forwards and options and embedded derivatives | $ | 28 | $ | 38 | $ | (167) | Other (income) expense, net | ||||||||||
CASH FLOW HEDGES
All changes in fair value of derivatives designated as cash flow hedge instruments are recorded in Accumulated other comprehensive income (loss) until Net income is affected by the variability of cash flows of the hedged transaction. Effective hedge results are classified in the Consolidated Statements of Income in the same manner as the underlying exposure. When it is no longer probable the forecasted hedged transaction will occur in the initially identified time period, hedge accounting is discontinued and the Company accounts for the associated derivative as an undesignated instrument as discussed below. Additionally, the gains and losses associated with derivatives no longer designated as cash flow hedge instruments in Accumulated other comprehensive income (loss) are recognized immediately in Other (income) expense, net, if it is probable the forecasted hedged transaction will not occur by the end of the initially identified time period or within an additional two-month period thereafter. In rare circumstances, the additional period of time may exceed two months due to extenuating circumstances related to the nature of the forecasted transaction that are outside the control or influence of the Company.
The purpose of the Company’s foreign exchange risk management program is to lessen both the positive and negative effects of currency fluctuations on the Company’s consolidated results of operations, financial position and cash flows. Foreign currency exposures the Company may elect to hedge in this manner include product costs, non-functional currency denominated revenues, intercompany revenues, demand creation expenses, investments in U.S. Dollar denominated available-for-sale debt securities and certain other intercompany transactions.
Product cost foreign currency exposures are primarily generated through non-functional currency denominated product purchases. NIKE entities primarily purchase product in two ways: (1) Certain NIKE entities purchase product from the NIKE Trading Company (“NTC”), a wholly-owned sourcing hub that buys NIKE branded products from third-party factories, predominantly in U.S. Dollars. The NTC, whose functional currency is the U.S. Dollar, then sells the product to NIKE entities in their respective functional currencies. NTC sales to a NIKE entity with a different functional currency result in a foreign currency
2023 FORM 10-K 79
Table of Contents
exposure for the NTC. (2) Other NIKE entities purchase product directly from third-party factories in U.S. Dollars. These purchases generate a foreign currency exposure for those NIKE entities with a functional currency other than the U.S. Dollar.
The Company’s policy permits the utilization of derivatives to reduce its foreign currency exposures where internal netting or other strategies cannot be effectively employed. Typically, the Company may enter into hedge contracts starting up to 12 to 24 months in advance of the forecasted transaction and may place incremental hedges up to 100% of the exposure by the time the forecasted transaction occurs. The total notional amount of outstanding foreign currency derivatives designated as cash flow hedges was $18.2 billion as of May 31, 2023.
As of May 31, 2023, approximately $419 million of deferred net gains (net of tax) on both outstanding and matured derivatives in Accumulated other comprehensive income (loss) are expected to be reclassified to Net income during the next 12 months concurrent with the underlying hedged transactions also being recorded in Net income. Actual amounts ultimately reclassified to Net income are dependent on the exchange rates in effect when derivative contracts currently outstanding mature. As of May 31, 2023, the maximum term over which the Company hedges exposures to the variability of cash flows for its forecasted transactions was 27 months.
FAIR VALUE HEDGES
The Company has, in the past, been exposed to the risk of changes in the fair value of certain fixed-rate debt attributable to changes in interest rates. Derivatives used by the Company to hedge this risk are receive-fixed, pay-variable interest rate swaps. The Company had no interest rate swaps designated as fair value hedges as of May 31, 2023.
NET INVESTMENT HEDGES
The Company has, in the past, hedged and may, in the future, hedge the risk of variability in foreign currency-denominated net investments in wholly-owned international operations. All changes in fair value of the derivatives designated as net investment hedges are reported in Accumulated other comprehensive income (loss) along with the foreign currency translation adjustments on those investments. The Company had no outstanding net investment hedges as of May 31, 2023.
UNDESIGNATED DERIVATIVE INSTRUMENTS
The Company may elect to enter into foreign exchange forwards to mitigate the change in fair value of specific assets and liabilities on the Consolidated Balance Sheets. These undesignated instruments are recorded at fair value as a derivative asset or liability on the Consolidated Balance Sheets with their corresponding change in fair value recognized in Other (income) expense, net, together with the remeasurement gain or loss from the hedged balance sheet position. The total notional amount of outstanding undesignated derivative instruments was $4.7 billion as of May 31, 2023.
CREDIT RISK
The Company is exposed to credit-related losses in the event of nonperformance by counterparties to hedging instruments. The counterparties to all derivative transactions are major financial institutions with investment grade credit ratings; however, this does not eliminate the Company’s exposure to credit risk with these institutions. This credit risk is limited to the unrealized gains in such contracts should any of these counterparties fail to perform as contracted. To manage this risk, the Company has established strict counterparty credit guidelines that are continually monitored.
The Company’s derivative contracts contain credit risk-related contingent features designed to protect against significant deterioration in counterparties’ creditworthiness and their ultimate ability to settle outstanding derivative contracts in the normal course of business. The Company’s bilateral credit-related contingent features generally require the owing entity, either the Company or the derivative counterparty, to post collateral for the portion of the fair value in excess of $50 million should the fair value of outstanding derivatives per counterparty be greater than $50 million. Additionally, a certain level of decline in credit rating of either the Company or the counterparty could trigger collateral requirements. As of May 31, 2023, the Company was in compliance with all credit risk-related contingent features, and derivative instruments with such features were in a net liability position of approximately $2 million. Accordingly, the Company posted no cash collateral as a result of these contingent features. Further, as of May 31, 2023, the Company had received $36 million in cash collateral from various counterparties to its derivative contracts. The Company considers the impact of the risk of counterparty default to be immaterial.
For additional information related to the Company’s derivative financial instruments and collateral, refer to Note 4 — Fair Value Measurements.
2023 FORM 10-K 80
Table of Contents
| NOTE 13 — ACCUMULATED OTHER COMPREHENSIVE INCOME (LOSS) | ||
The changes in Accumulated other comprehensive income (loss), net of tax, were as follows:
| (Dollars in millions) | FOREIGN CURRENCY TRANSLATION ADJUSTMENT(1) | CASH FLOW HEDGES | NET INVESTMENT HEDGES(1) | OTHER | TOTAL | ||||||||||||
| Balance at May 31, 2022 | $ | (520) | $ | 779 | $ | 115 | $ | (56) | $ | 318 | |||||||
| Other comprehensive income (loss): | |||||||||||||||||
| Other comprehensive gains (losses) before reclassifications(2) | (91) | 487 | — | (20) | 376 | ||||||||||||
| Reclassifications to net income of previously deferred (gains) losses(3) | 358 | (835) | — | 14 | (463) | ||||||||||||
| Total other comprehensive income (loss) | 267 | (348) | — | (6) | (87) | ||||||||||||
| Balance at May 31, 2023 | $ | (253) | $ | 431 | $ | 115 | $ | (62) | $ | 231 | |||||||
(1)The accumulated foreign currency translation adjustment and net investment hedge gains/losses related to an investment in a foreign subsidiary are reclassified to Net income upon sale or upon complete or substantially complete liquidation of the respective entity.
(2)Net of tax benefit (expense) of $0 million, $(40) million, $0 million, $6 million and $(34) million, respectively.
(3)Net of tax (benefit) expense of $(16) million, $97 million, $0 million, $(5) million and $76 million, respectively.
| (Dollars in millions) | FOREIGN CURRENCY TRANSLATION ADJUSTMENT(1) | CASH FLOW HEDGES | NET INVESTMENT HEDGES(1) | OTHER | TOTAL | ||||||||||||
| Balance at May 31, 2021 | $ | 2 | $ | (435) | $ | 115 | $ | (62) | $ | (380) | |||||||
| Other comprehensive income (loss): | |||||||||||||||||
| Other comprehensive gains (losses) before reclassifications(2) | (522) | 1,222 | — | 28 | 728 | ||||||||||||
| Reclassifications to net income of previously deferred (gains) losses(3) | — | (8) | — | (22) | (30) | ||||||||||||
| Total other comprehensive income (loss) | (522) | 1,214 | — | 6 | 698 | ||||||||||||
| Balance at May 31, 2022 | $ | (520) | $ | 779 | $ | 115 | $ | (56) | $ | 318 | |||||||
(1)The accumulated foreign currency translation adjustment and net investment hedge gains/losses related to an investment in a foreign subsidiary are reclassified to Net income upon sale or upon complete or substantially complete liquidation of the respective entity.
(2)Net of tax benefit (expense) of $0 million, $(114) million, $0 million, $(9) million and $(123) million, respectively.
(3)Net of tax (benefit) expense of $0 million, $11 million, $0 million, $9 million and $20 million, respectively.
2023 FORM 10-K 81
Table of Contents
The following table summarizes the reclassifications from Accumulated other comprehensive income (loss) to the Consolidated Statements of Income:
| AMOUNT OF GAIN (LOSS) RECLASSIFIED FROM ACCUMULATED OTHER COMPREHENSIVE INCOME (LOSS) INTO INCOME | LOCATION OF GAIN (LOSS) RECLASSIFIED FROM ACCUMULATED OTHER COMPREHENSIVE INCOME (LOSS) INTO INCOME | ||||||||||
| YEAR ENDED MAY 31, | |||||||||||
| (Dollars in millions) | 2023 | 2022 | |||||||||
| Gains (losses) on foreign currency translation adjustment | $ | (374) | $ | — | Other (income) expense, net | ||||||
| Total before tax | (374) | — | |||||||||
| Tax (expense) benefit | 16 | — | |||||||||
| Gain (loss) net of tax | (358) | — | |||||||||
| Gains (losses) on cash flow hedges: | |||||||||||
| Foreign exchange forwards and options | 26 | (82) | Revenues | ||||||||
| Foreign exchange forwards and options | 581 | (23) | Cost of sales | ||||||||
| Foreign exchange forwards and options | (5) | 1 | Demand creation expense | ||||||||
| Foreign exchange forwards and options | 338 | 130 | Other (income) expense, net | ||||||||
| Interest rate swaps | (8) | (7) | Interest expense (income), net | ||||||||
| Total before tax | 932 | 19 | |||||||||
| Tax (expense) benefit | (97) | (11) | |||||||||
| Gain (loss) net of tax | 835 | 8 | |||||||||
| Gains (losses) on other | (19) | 31 | Other (income) expense, net | ||||||||
| Total before tax | (19) | 31 | |||||||||
| Tax (expense) benefit | 5 | (9) | |||||||||
| Gain (loss) net of tax | (14) | 22 | |||||||||
| Total net gain (loss) reclassified for the period | $ | 463 | $ | 30 | |||||||
2023 FORM 10-K 82
Table of Contents
| NOTE 14 — REVENUES | ||
DISAGGREGATION OF REVENUES
The following tables present the Company’s Revenues disaggregated by reportable operating segment, major product line and distribution channel:
| YEAR ENDED MAY 31, 2023 | |||||||||||||||||||||||||||||
| (Dollars in millions) | NORTH AMERICA | EUROPE, MIDDLE EAST & AFRICA | GREATER CHINA | ASIA PACIFIC & LATIN AMERICA(1) | GLOBAL BRAND DIVISIONS | TOTAL NIKE BRAND | CONVERSE | CORPORATE | TOTAL NIKE, INC. | ||||||||||||||||||||
| Revenues by: | |||||||||||||||||||||||||||||
| Footwear | $ | 14,897 | $ | 8,260 | $ | 5,435 | $ | 4,543 | $ | — | $ | 33,135 | $ | 2,155 | $ | — | $ | 35,290 | |||||||||||
| Apparel | 5,947 | 4,566 | 1,666 | 1,664 | — | 13,843 | 90 | — | 13,933 | ||||||||||||||||||||
| Equipment | 764 | 592 | 147 | 224 | — | 1,727 | 28 | — | 1,755 | ||||||||||||||||||||
| Other | — | — | — | — | 58 | 58 | 154 | 27 | 239 | ||||||||||||||||||||
| TOTAL REVENUES | $ | 21,608 | $ | 13,418 | $ | 7,248 | $ | 6,431 | $ | 58 | $ | 48,763 | $ | 2,427 | $ | 27 | $ | 51,217 | |||||||||||
| Revenues by: | |||||||||||||||||||||||||||||
| Sales to Wholesale Customers | $ | 11,273 | $ | 8,522 | $ | 3,866 | $ | 3,736 | $ | — | $ | 27,397 | $ | 1,299 | $ | — | $ | 28,696 | |||||||||||
| Sales through Direct to Consumer | 10,335 | 4,896 | 3,382 | 2,695 | — | 21,308 | 974 | — | 22,282 | ||||||||||||||||||||
| Other | — | — | — | — | 58 | 58 | 154 | 27 | 239 | ||||||||||||||||||||
| TOTAL REVENUES | $ | 21,608 | $ | 13,418 | $ | 7,248 | $ | 6,431 | $ | 58 | $ | 48,763 | $ | 2,427 | $ | 27 | $ | 51,217 | |||||||||||
(1)Refer to Note 18 — Acquisitions and Divestitures for additional information on the transition of the Company’s NIKE Brand businesses in its CASA territory to third-party distributors.
| YEAR ENDED MAY 31, 2022 | |||||||||||||||||||||||||||||
| (Dollars in millions) | NORTH AMERICA | EUROPE, MIDDLE EAST & AFRICA | GREATER CHINA | ASIA PACIFIC & LATIN AMERICA | GLOBAL BRAND DIVISIONS | TOTAL NIKE BRAND | CONVERSE | CORPORATE | TOTAL NIKE, INC. | ||||||||||||||||||||
| Revenues by: | |||||||||||||||||||||||||||||
| Footwear | $ | 12,228 | $ | 7,388 | $ | 5,416 | $ | 4,111 | $ | — | $ | 29,143 | $ | 2,094 | $ | — | $ | 31,237 | |||||||||||
| Apparel | 5,492 | 4,527 | 1,938 | 1,610 | — | 13,567 | 103 | — | 13,670 | ||||||||||||||||||||
| Equipment | 633 | 564 | 193 | 234 | — | 1,624 | 26 | — | 1,650 | ||||||||||||||||||||
| Other | — | — | — | — | 102 | 102 | 123 | (72) | 153 | ||||||||||||||||||||
| TOTAL REVENUES | $ | 18,353 | $ | 12,479 | $ | 7,547 | $ | 5,955 | $ | 102 | $ | 44,436 | $ | 2,346 | $ | (72) | $ | 46,710 | |||||||||||
| Revenues by: | |||||||||||||||||||||||||||||
| Sales to Wholesale Customers | $ | 9,621 | $ | 8,377 | $ | 4,081 | $ | 3,529 | $ | — | $ | 25,608 | $ | 1,292 | $ | — | $ | 26,900 | |||||||||||
| Sales through Direct to Consumer | 8,732 | 4,102 | 3,466 | 2,426 | — | 18,726 | 931 | — | 19,657 | ||||||||||||||||||||
| Other | — | — | — | — | 102 | 102 | 123 | (72) | 153 | ||||||||||||||||||||
| TOTAL REVENUES | $ | 18,353 | $ | 12,479 | $ | 7,547 | $ | 5,955 | $ | 102 | $ | 44,436 | $ | 2,346 | $ | (72) | $ | 46,710 | |||||||||||
2023 FORM 10-K 83
Table of Contents
| YEAR ENDED MAY 31, 2021 | |||||||||||||||||||||||||||||
| (Dollars in millions) | NORTH AMERICA | EUROPE, MIDDLE EAST & AFRICA | GREATER CHINA | ASIA PACIFIC & LATIN AMERICA(1) | GLOBAL BRAND DIVISIONS | TOTAL NIKE BRAND | CONVERSE | CORPORATE | TOTAL NIKE, INC. | ||||||||||||||||||||
| Revenues by: | |||||||||||||||||||||||||||||
| Footwear | $ | 11,644 | $ | 6,970 | $ | 5,748 | $ | 3,659 | $ | — | $ | 28,021 | $ | 1,986 | $ | — | $ | 30,007 | |||||||||||
| Apparel | 5,028 | 3,996 | 2,347 | 1,494 | — | 12,865 | 104 | — | 12,969 | ||||||||||||||||||||
| Equipment | 507 | 490 | 195 | 190 | — | 1,382 | 29 | — | 1,411 | ||||||||||||||||||||
| Other | — | — | — | — | 25 | 25 | 86 | 40 | 151 | ||||||||||||||||||||
| TOTAL REVENUES | $ | 17,179 | $ | 11,456 | $ | 8,290 | $ | 5,343 | $ | 25 | $ | 42,293 | $ | 2,205 | $ | 40 | $ | 44,538 | |||||||||||
| Revenues by: | |||||||||||||||||||||||||||||
| Sales to Wholesale Customers | $ | 10,186 | $ | 7,812 | $ | 4,513 | $ | 3,387 | $ | — | $ | 25,898 | $ | 1,353 | $ | — | $ | 27,251 | |||||||||||
| Sales through Direct to Consumer | 6,993 | 3,644 | 3,777 | 1,956 | — | 16,370 | 766 | — | 17,136 | ||||||||||||||||||||
| Other | — | — | — | — | 25 | 25 | 86 | 40 | 151 | ||||||||||||||||||||
| TOTAL REVENUES | $ | 17,179 | $ | 11,456 | $ | 8,290 | $ | 5,343 | $ | 25 | $ | 42,293 | $ | 2,205 | $ | 40 | $ | 44,538 | |||||||||||
(1) Refer to Note 18 — Acquisitions and Divestitures for additional information on the transition of the Company’s NIKE Brand business in Brazil to a third-party distributor.
For the fiscal years ended May 31, 2023, 2022 and 2021, Global Brand Divisions revenues include NIKE Brand licensing and other miscellaneous revenues that are not part of a geographic operating segment. Converse Other revenues were primarily attributable to licensing businesses. Corporate revenues primarily consisted of foreign currency hedge gains and losses related to revenues generated by entities within the NIKE Brand geographic operating segments and Converse but managed through the Company’s central foreign exchange risk management program.
As of May 31, 2023 and 2022, the Company did not have any contract assets and had an immaterial amount of contract liabilities recorded in Accrued liabilities on the Consolidated Balance Sheets.
SALES-RELATED RESERVES
As of May 31, 2023 and 2022, the Company’s sales-related reserve balance, which includes returns, post-invoice sales discounts and miscellaneous claims, was $994 million and $1,015 million, respectively, recorded in Accrued liabilities on the Consolidated Balance Sheets. The estimated cost of inventory for expected product returns was $226 million and $194 million as of May 31, 2023 and 2022, respectively, and was recorded in Prepaid expenses and other current assets on the Consolidated Balance Sheets.
| NOTE 15 — OPERATING SEGMENTS AND RELATED INFORMATION | ||
The Company’s operating segments are evidence of the structure of the Company’s internal organization. The NIKE Brand segments are defined by geographic regions for operations participating in NIKE Brand sales activity.
Each NIKE Brand geographic segment operates predominantly in one industry: the design, development, marketing and selling of athletic footwear, apparel and equipment. The Company’s reportable operating segments for the NIKE Brand are: North America; Europe, Middle East & Africa (“EMEA”); Greater China; and Asia Pacific & Latin America (“APLA”), and include results for the NIKE and Jordan brands. Refer to Note 18 — Acquisitions and Divestitures for information regarding the transition of NIKE Brand businesses in certain countries within APLA to third-party distributors.
The Company’s NIKE Direct operations are managed within each NIKE Brand geographic operating segment. Converse is also a reportable segment for the Company and operates in one industry: the design, marketing, licensing and selling of athletic lifestyle sneakers, apparel and accessories.
Global Brand Divisions is included within the NIKE Brand for presentation purposes to align with the way management views the Company. Global Brand Divisions revenues include NIKE Brand licensing and other miscellaneous revenues that are not part of a geographic operating segment. Global Brand Divisions costs represent demand creation and operating overhead expense that include product creation and design expenses centrally managed for the NIKE Brand, as well as costs associated with NIKE Direct global digital operations and enterprise technology.
2023 FORM 10-K 84
Table of Contents
Corporate consists primarily of unallocated general and administrative expenses, including expenses associated with centrally managed departments; depreciation and amortization related to the Company’s headquarters; unallocated insurance, benefit and compensation programs, including stock-based compensation; and certain foreign currency gains and losses, including certain hedge gains and losses.
The primary financial measure used by the Company to evaluate performance of individual operating segments is earnings before interest and taxes (“EBIT”), which represents Net income before Interest expense (income), net and Income tax expense in the Consolidated Statements of Income.
As part of the Company’s centrally managed foreign exchange risk management program, standard foreign currency rates are assigned twice per year to each NIKE Brand entity in the Company’s geographic operating segments and to Converse. These rates are set approximately nine and twelve months in advance of the future selling seasons to which they relate (specifically, for each currency, one standard rate applies to the fall and holiday selling seasons, and one standard rate applies to the spring and summer selling seasons) based on average market spot rates in the calendar month preceding the date they are established. Inventories and Cost of sales for geographic operating segments and Converse reflect the use of these standard rates to record non-functional currency product purchases in the entity’s functional currency. Differences between assigned standard foreign currency rates and actual market rates are included in Corporate, together with foreign currency hedge gains and losses generated from the Company’s centrally managed foreign exchange risk management program and other conversion gains and losses.
Accounts receivable, net, Inventories and Property, plant and equipment, net for operating segments are regularly reviewed by management and are therefore provided below.
2023 FORM 10-K 85
Table of Contents
| YEAR ENDED MAY 31, | |||||||||||
| (Dollars in millions) | 2023 | 2022 | 2021 | ||||||||
| REVENUES | |||||||||||
| North America | $ | 21,608 | $ | 18,353 | $ | 17,179 | |||||
| Europe, Middle East & Africa | 13,418 | 12,479 | 11,456 | ||||||||
| Greater China | 7,248 | 7,547 | 8,290 | ||||||||
| Asia Pacific & Latin America | 6,431 | 5,955 | 5,343 | ||||||||
| Global Brand Divisions | 58 | 102 | 25 | ||||||||
| Total NIKE Brand | 48,763 | 44,436 | 42,293 | ||||||||
| Converse | 2,427 | 2,346 | 2,205 | ||||||||
| Corporate | 27 | (72) | 40 | ||||||||
| TOTAL NIKE, INC. REVENUES | $ | 51,217 | $ | 46,710 | $ | 44,538 | |||||
| EARNINGS BEFORE INTEREST AND TAXES | |||||||||||
| North America | $ | 5,454 | $ | 5,114 | $ | 5,089 | |||||
| Europe, Middle East & Africa | 3,531 | 3,293 | 2,435 | ||||||||
| Greater China | 2,283 | 2,365 | 3,243 | ||||||||
| Asia Pacific & Latin America | 1,932 | 1,896 | 1,530 | ||||||||
| Global Brand Divisions | (4,841) | (4,262) | (3,656) | ||||||||
| Converse | 676 | 669 | 543 | ||||||||
| Corporate | (2,840) | (2,219) | (2,261) | ||||||||
| Interest expense (income), net | (6) | 205 | 262 | ||||||||
| TOTAL NIKE, INC. INCOME BEFORE INCOME TAXES | $ | 6,201 | $ | 6,651 | $ | 6,661 | |||||
| ADDITIONS TO PROPERTY, PLANT AND EQUIPMENT | |||||||||||
| North America | $ | 283 | $ | 146 | $ | 98 | |||||
| Europe, Middle East & Africa | 215 | 197 | 153 | ||||||||
| Greater China | 56 | 78 | 94 | ||||||||
| Asia Pacific & Latin America | 64 | 56 | 54 | ||||||||
| Global Brand Divisions | 271 | 222 | 278 | ||||||||
| Total NIKE Brand | 889 | 699 | 677 | ||||||||
| Converse | 7 | 9 | 7 | ||||||||
| Corporate | 140 | 103 | 107 | ||||||||
| TOTAL ADDITIONS TO PROPERTY, PLANT AND EQUIPMENT | $ | 1,036 | $ | 811 | $ | 791 | |||||
| DEPRECIATION | |||||||||||
| North America | $ | 128 | $ | 124 | $ | 130 | |||||
| Europe, Middle East & Africa | 120 | 134 | 136 | ||||||||
| Greater China | 54 | 41 | 46 | ||||||||
| Asia Pacific & Latin America | 42 | 42 | 43 | ||||||||
| Global Brand Divisions | 211 | 220 | 222 | ||||||||
| Total NIKE Brand | 555 | 561 | 577 | ||||||||
| Converse | 17 | 22 | 26 | ||||||||
| Corporate | 131 | 134 | 141 | ||||||||
| TOTAL DEPRECIATION | $ | 703 | $ | 717 | $ | 744 | |||||
2023 FORM 10-K 86
Table of Contents
| AS OF MAY 31, | ||||||||
| (Dollars in millions) | 2023 | 2022 | ||||||
| ACCOUNTS RECEIVABLE, NET | ||||||||
| North America | $ | 1,653 | $ | 1,850 | ||||
| Europe, Middle East & Africa | 1,197 | 1,351 | ||||||
| Greater China | 162 | 406 | ||||||
| Asia Pacific & Latin America(1) | 700 | 664 | ||||||
| Global Brand Divisions | 96 | 113 | ||||||
| Total NIKE Brand | 3,808 | 4,384 | ||||||
| Converse | 235 | 230 | ||||||
| Corporate | 88 | 53 | ||||||
| TOTAL ACCOUNTS RECEIVABLE, NET | $ | 4,131 | $ | 4,667 | ||||
| INVENTORIES | ||||||||
| North America | $ | 3,806 | $ | 4,098 | ||||
| Europe, Middle East & Africa | 2,167 | 1,887 | ||||||
| Greater China | 973 | 1,044 | ||||||
| Asia Pacific & Latin America(1) | 894 | 686 | ||||||
| Global Brand Divisions | 232 | 197 | ||||||
| Total NIKE Brand | 8,072 | 7,912 | ||||||
| Converse | 305 | 279 | ||||||
| Corporate | 77 | 229 | ||||||
| TOTAL INVENTORIES | $ | 8,454 | $ | 8,420 | ||||
| PROPERTY, PLANT AND EQUIPMENT, NET | ||||||||
| North America | $ | 794 | $ | 639 | ||||
| Europe, Middle East & Africa | 1,009 | 920 | ||||||
| Greater China | 292 | 303 | ||||||
| Asia Pacific & Latin America(1) | 279 | 274 | ||||||
| Global Brand Divisions | 840 | 789 | ||||||
| Total NIKE Brand | 3,214 | 2,925 | ||||||
| Converse | 38 | 49 | ||||||
| Corporate | 1,829 | 1,817 | ||||||
| TOTAL PROPERTY, PLANT AND EQUIPMENT, NET | $ | 5,081 | $ | 4,791 | ||||
(1)Excludes assets held-for-sale as of May 31, 2022. See Note 18 — Acquisitions and Divestitures for additional information.
REVENUES AND LONG-LIVED ASSETS BY GEOGRAPHIC AREA
After allocation of revenues for Global Brand Divisions, Converse and Corporate to geographical areas based on the location where the sales originated, revenues by geographical area are essentially the same as reported above for the NIKE Brand operating segments with the exception of the United States. Revenues derived in the United States were $22,007 million, $18,749 million and $17,363 million for the fiscal years ended May 31, 2023, 2022 and 2021, respectively.
The Company’s largest concentrations of long-lived assets primarily consist of the Company’s corporate headquarters, retail locations and distribution facilities in the United States and China, as well as distribution facilities in Belgium. Long-lived assets attributable to operations in these countries, which consist of property, plant and equipment, net and operating lease ROU assets, net, were as follows:
| MAY 31, | ||||||||
| (Dollars in millions) | 2023 | 2022 | ||||||
| United States | $ | 5,129 | $ | 4,916 | ||||
| Belgium | 702 | 646 | ||||||
| China | 559 | 538 | ||||||
2023 FORM 10-K 87
Table of Contents
| NOTE 16 — COMMITMENTS AND CONTINGENCIES | ||
As of May 31, 2023 and 2022, the Company had bank guarantees and letters of credit outstanding totaling $588 million and $289 million, respectively, issued primarily for real estate agreements, self-insurance programs, other general business obligations and legal matters.
In connection with various contracts and agreements, the Company provides routine indemnification relating to the enforceability of intellectual property rights, coverage for legal issues that arise and other items where the Company is acting as the guarantor. Currently, the Company has several such agreements in place. However, based on the Company’s historical experience and the estimated probability of future loss, the Company has determined the fair value of such indemnification is not material to the Company’s financial position or results of operations.
In the ordinary course of business, the Company is subject to various legal proceedings, claims and government investigations relating to its business, products and actions of its employees and representatives, including contractual and employment relationships, product liability, antitrust, customs, tax, intellectual property and other matters. The outcome of these legal matters is inherently uncertain, and the Company cannot predict the eventual outcome of currently pending matters, the timing of their ultimate resolution or the eventual losses, fines, penalties or consequences relating to those matters. When a loss related to a legal proceeding or claim is probable and reasonably estimable, the Company accrues its best estimate for the ultimate resolution of the matter. If one or more legal matters were to be resolved against the Company in a reporting period for amounts above management’s expectations, the Company’s financial position, operating results and cash flows for that reporting period could be materially adversely affected. In the opinion of management, based on its current knowledge and after consultation with counsel, the Company does not believe any currently pending legal matters will have a material adverse impact on the Company’s results of operations, financial position or cash flows, except as described below.
BELGIAN CUSTOMS CLAIM
The Company has received claims for certain years from the Belgian Customs Authorities for alleged underpaid duties related to products imported beginning in fiscal 2018. The Company disputes these claims and has engaged in the appellate process. The Company has issued bank guarantees in order to appeal the claims. At this time, the Company is unable to estimate the range of loss and cannot predict the final outcome as it could take several years to reach a resolution on this matter. If this matter is ultimately resolved against the Company, the amounts owed, including fines, penalties and other consequences relating to the matter, could have a material adverse effect on the Company’s results of operations, financial position and cash flows.
| NOTE 17 — LEASES | ||
Lease expense is recognized in Cost of sales or Operating overhead expense within the Consolidated Statements of Income, based on the underlying nature of the leased asset. For the fiscal years ended May 31, 2023, 2022 and 2021, lease expense primarily consisted of operating lease costs of $585 million, $593 million and $589 million, respectively. Lease expense also consisted of $403 million, $366 million and $347 million for fiscal years ended May 31, 2023, 2022 and 2021, respectively, primarily related to variable lease costs, which includes an immaterial amount of short-term lease costs. As of and for the fiscal years ended May 31, 2023 and 2022 and 2021, finance leases were not a material component of the Company’s lease portfolio.
The undiscounted cash flows for future maturities of the Company’s operating lease liabilities and the reconciliation to the Operating lease liabilities recognized in the Company’s Consolidated Balance Sheets are as follows:
| (Dollars in millions) | AS OF MAY 31, 2023(1) | ||||
| Fiscal 2024 | $ | 506 | |||
| Fiscal 2025 | 562 | ||||
| Fiscal 2026 | 490 | ||||
| Fiscal 2027 | 436 | ||||
| Fiscal 2028 | 369 | ||||
| Thereafter | 1,225 | ||||
| Total undiscounted future cash flows related to lease payments | $ | 3,588 | |||
| Less interest | 377 | ||||
| Present value of lease liabilities | $ | 3,211 | |||
(1)Excludes $278 million as of May 31, 2023, of future operating lease payments for lease agreements signed but not yet commenced.
2023 FORM 10-K 88
Table of Contents
The following table includes supplemental information used to calculate the present value of Operating lease liabilities:
| AS OF MAY 31, | ||||||||
| 2023 | 2022 | |||||||
| Weighted-average remaining lease term (in years) | 7.5 | 7.8 | ||||||
| Weighted-average discount rate | 2.5 | % | 2.3 | % | ||||
The following table includes supplemental cash and non-cash information related to operating leases:
| YEAR ENDED MAY 31, | ||||||||||||||||||||
| (Dollars in millions) | 2023 | 2022 | 2021 | |||||||||||||||||
| Cash paid for amounts included in the measurement of lease liabilities: | ||||||||||||||||||||
| Operating cash flows from operating leases | $ | 575 | $ | 589 | $ | 583 | ||||||||||||||
| Operating lease right-of-use assets obtained in exchange for new operating lease liabilities | $ | 602 | $ | 537 | $ | 489 | ||||||||||||||
| NOTE 18 — ACQUISITIONS AND DIVESTITURES | ||
ACQUISITIONS
During fiscal 2023, 2022 and 2021, the Company made multiple acquisitions focused on gaining new capabilities to fuel its Consumer Direct Acceleration strategy, serving consumers personally at a global scale. The impact of acquisitions, individually and in aggregate, was not considered material to the Company’s Consolidated Financial Statements.
DIVESTITURES
During the fourth quarter of fiscal 2022, the Company entered into separate definitive agreements to sell its entities in Argentina and Uruguay as well as its entity in Chile to third-party distributors.
The sale of the Company’s entity in Chile to a third-party distributor was completed during the first quarter of fiscal 2023. The impacts from the transaction were not material to the Company’s Consolidated Financial Statements.
The sale of the Company’s entities in Argentina and Uruguay to a third-party distributor was completed during the second quarter of fiscal 2023 and the net loss on the sale of these entities totaled approximately $550 million. This loss included $389 million, recognized primarily in fiscal 2020, largely due to the anticipated release of the cumulative foreign currency translation losses. The remaining loss recognized in fiscal 2023 was due to the devaluation of local currency and cash equivalents included in the transferred assets. Upon completion of the sale, the foreign currency translation losses recorded in Accumulated other comprehensive income (loss) were reclassified to Net income within Other (income) expense, net, on the Company’s Consolidated Statements of Comprehensive Income along with the allowance for previously recognized losses recorded in Accrued liabilities. The net loss was classified within Corporate.
The net cash proceeds received are reflected within Other investing activities on the Company’s Consolidated Statements of Cash Flows.
The related assets and liabilities of these entities within the Company’s APLA operating segment were classified as held-for-sale on the Consolidated Balance Sheets within Prepaid expenses and other currents and Accrued liabilities, respectively, until the transactions closed. As of May 31, 2022, held-for-sale assets were $182 million and held-for-sale liabilities were $58 million.
OTHER DIVESTITURES
During fiscal 2020, the Company entered into a definitive agreement to sell substantially all of its NIKE Brand operations in Brazil and shift to a distributor operating model. During fiscal 2021, the transaction closed and the Company recognized a loss of approximately $50 million within Other (income) expense, net classified within Corporate, on the Consolidated Statements of Income. Cash proceeds received were reflected within Other investing activities on the Consolidated Statements of Cash Flows.
2023 FORM 10-K 89
Table of Contents
| NOTE 19 — RESTRUCTURING | ||
In fiscal 2021, the Company substantially completed a series of leadership and operating model changes to streamline and speed up the strategic execution of the Consumer Direct Acceleration.
For the fiscal year ended May 31, 2021, the Company recognized employee termination costs of $214 million and $35 million within Operating overhead expense and Cost of sales, respectively, and made cash payments of $212 million. Additionally, the related stock-based compensation expense recorded within Operating overhead expense and Cost of sales was $41 million and $4 million, respectively.
These costs were classified within Corporate.
2023 FORM 10-K 90
Table of Contents
ITEM 9. CHANGES IN AND DISAGREEMENTS WITH ACCOUNTANTS ON ACCOUNTING AND FINANCIAL DISCLOSURE
There has been no change of accountants nor any disagreements with accountants on any matter of accounting principles or practices or financial statement disclosure required to be reported under this Item.
ITEM 9A. CONTROLS AND PROCEDURES
We maintain disclosure controls and procedures that are designed to provide reasonable assurance that information required to be disclosed in our Securities Exchange Act of 1934, as amended (the “Exchange Act”), reports is recorded, processed, summarized and reported within the time periods specified in the Securities and Exchange Commission’s rules and forms and that such information is accumulated and communicated to our management, including our Chief Executive Officer and Chief Financial Officer, as appropriate, to allow for timely decisions regarding required disclosure. In designing and evaluating the disclosure controls and procedures, management recognizes that any controls and procedures, no matter how well designed and operated, can provide only reasonable assurance of achieving the desired control objectives, and management is required to apply its judgment in evaluating the cost-benefit relationship of possible controls and procedures.
We carry out a variety of ongoing procedures, under the supervision and with the participation of our management, including our Chief Executive Officer and Chief Financial Officer, to evaluate the effectiveness of the design and operation of our disclosure controls and procedures. Based on the foregoing, our Chief Executive Officer and Chief Financial Officer concluded that our disclosure controls and procedures were effective at the reasonable assurance level as of May 31, 2023.
“Management’s Annual Report on Internal Control Over Financial Reporting” is included in Item 8 of this Annual Report.
We are continuing several transformation initiatives to centralize and simplify our business processes and systems. These are long-term initiatives, which we believe will enhance our internal control over financial reporting due to increased automation and further integration of related processes. We will continue to monitor our internal control over financial reporting for effectiveness throughout these transformation initiatives.
There have not been any changes in our internal control over financial reporting during our most recent fiscal quarter that have materially affected, or are reasonably likely to materially affect, our internal control over financial reporting.
ITEM 9B. OTHER INFORMATION
No disclosure is required under this item.
ITEM 9C. DISCLOSURE REGARDING FOREIGN JURISDICTIONS THAT PREVENT INSPECTIONS
Not applicable.
2023 FORM 10-K 91
Table of Contents
PART III
ITEM 10. DIRECTORS, EXECUTIVE OFFICERS AND CORPORATE GOVERNANCE
The information required by Item 401 of Regulation S-K regarding directors is included under “Corporate Governance — NIKE, Inc. Board of Directors” in the definitive Proxy Statement for our 2023 Annual Meeting of Shareholders and is incorporated herein by reference. The information required by Item 401 of Regulation S-K regarding executive officers is included under “Information about our Executive Officers” in Item 1 of this Annual Report. The information required by Item 406 of Regulation S-K is included under “Corporate Governance — Code of Conduct” in the definitive Proxy Statement for our 2023 Annual Meeting of Shareholders and is incorporated herein by reference. The information required by Items 407(d)(4) and (d)(5) of Regulation S-K regarding the Audit & Finance Committee of the Board of Directors is included under “Corporate Governance — Board Structure and Responsibilities — Board Committees” in the definitive Proxy Statement for our 2023 Annual Meeting of Shareholders and is incorporated herein by reference.
ITEM 11. EXECUTIVE COMPENSATION
The information required by Items 402, 407(e)(4) and 407(e)(5) of Regulation S-K regarding executive compensation is included under “Corporate Governance — Director Compensation for Fiscal 2023,” “Executive Compensation — Compensation Discussion and Analysis,” “Executive Compensation — Executive Compensation Tables,” and “Additional Information — Compensation Committee Interlocks and Insider Participation,” in the definitive Proxy Statement for our 2023 Annual Meeting of Shareholders and is incorporated herein by reference.
ITEM 12. SECURITY OWNERSHIP OF CERTAIN BENEFICIAL OWNERS AND MANAGEMENT AND RELATED STOCKHOLDER MATTERS
The information required by Item 201(d) of Regulation S-K is included under “Executive Compensation — Executive Compensation Tables — Equity Compensation Plan Information” in the definitive Proxy Statement for our 2023 Annual Meeting of Shareholders and is incorporated herein by reference. The information required by Item 403 of Regulation S-K is included under “Stock Ownership Information — Stock Holdings of Certain Owners and Management” in the definitive Proxy Statement for our 2023 Annual Meeting of Shareholders and is incorporated herein by reference.
ITEM 13. CERTAIN RELATIONSHIPS AND RELATED TRANSACTIONS AND DIRECTOR INDEPENDENCE
The information required by Items 404 and 407(a) of Regulation S-K is included under “Additional Information — Transactions with Related Persons” and “Corporate Governance — NIKE, Inc. Board of Directors — Director Independence” in the definitive Proxy Statement for our 2023 Annual Meeting of Shareholders and is incorporated herein by reference.
ITEM 14. PRINCIPAL ACCOUNTANT FEES AND SERVICES
The information required by Item 9(e) of Schedule 14A is included under “Audit Matters — Ratification of Appointment of Independent Registered Public Accounting Firm” in the definitive Proxy Statement for our 2023 Annual Meeting of Shareholders and is incorporated herein by reference.
2023 FORM 10-K 92
Table of Contents
PART IV
ITEM 15. EXHIBITS AND FINANCIAL STATEMENT SCHEDULES
| (a) | The following documents are filed as part of this Annual Report: | |||||||
| FORM 10-K PAGE NO. | ||||||||
| 1. | Financial Statements: | |||||||
| Report of Independent Registered Public Accounting Firm (PCAOB ID 238) | 53 | |||||||
| Consolidated Statements of Income for each of the three years ended May 31, 2023, May 31, 2022 and May 31, 2021 | 55 | |||||||
| Consolidated Statements of Comprehensive Income for each of the three years ended May 31, 2023, May 31, 2022 and May 31, 2021 | 56 | |||||||
| Consolidated Balance Sheets at May 31, 2023 and May 31, 2022 | 57 | |||||||
| Consolidated Statements of Cash Flows for each of the three years ended May 31, 2023, May 31, 2022 and May 31, 2021 | 58 | |||||||
| Consolidated Statements of Shareholders’ Equity for each of the three years ended May 31, 2023, May 31, 2022 and May 31, 2021 | 59 | |||||||
| Notes to Consolidated Financial Statements | 60 | |||||||
| 2. | Financial Statement Schedule: | |||||||
| II — Valuation and Qualifying Accounts for the years ended May 31, 2023, 2022 and 2021 | 96 | |||||||
| All other schedules are omitted because they are not applicable or the required information is shown in the financial statements or notes thereto. | ||||||||
| 3. | Exhibits: | |||||||
| 3.1 | Restated Articles of Incorporation, as amended (incorporated by reference to Exhibit 3.1 to the Company’s Quarterly Report on Form 10-Q for the fiscal quarter ended November 30, 2015). | |||||||
| 3.2 | Fifth Restated Bylaws, as amended (incorporated by reference to Exhibit 3.1 to the Company’s Current Report on Form 8-K filed June 19, 2020). | |||||||
| 4.1 | Restated Articles of Incorporation, as amended (see Exhibit 3.1). | |||||||
| 4.2 | Fifth Restated Bylaws, as amended (see Exhibit 3.2). | |||||||
| 4.3 | Indenture dated as of April 26, 2013, by and between NIKE, Inc. and Deutsche Bank Trust Company Americas, as trustee (incorporated by reference to Exhibit 4.1 to the Company’s Form 8-K filed April 26, 2013). | |||||||
| 4.4 | Second Supplemental Indenture, dated as of October 29, 2015, by and between NIKE, Inc. and Deutsche Bank Trust Company Americas, as trustee, including the form of 3.875% Notes due 2045 (incorporated by reference to Exhibit 4.2 to the Company’s Form 8-K filed October 29, 2015). | |||||||
| 4.5 | Third Supplemental Indenture, dated as of October 21, 2016, by and between NIKE, Inc. and Deutsche Bank Trust Company Americas, as trustee, including the form of 2.375% Notes due 2026 and form of 3.375% Notes due 2046 (incorporated by reference to Exhibit 4.2 to the Company’s Form 8-K filed October 21, 2016). | |||||||
| 4.6 | Fourth Supplemental Indenture, dated as of March 27, 2020, by and between NIKE, Inc. and Deutsche Bank Trust Company Americas, as trustee, including the form of 2.400% Notes due 2025, form of 2.750% Notes due 2027, form of 2.850% Notes due 2030, form of 3.250% Notes due 2040 and form of 3.375% Notes due 2050 (incorporated by reference to Exhibit 4.2 to the Company’s Form 8-K filed March 27, 2020). | |||||||
| 4.7 | Description of Registrants Securities (incorporated by reference to Exhibit 4.6 to the Company’s Annual Report on Form 10-K for the fiscal year ended May 31, 2019). | |||||||
| 10.1 | Form of Non-Statutory Stock Option Agreement for options granted to non-employee directors under the 1990 Stock Incentive Plan (incorporated by reference to Exhibit 10.2 to the Company’s Annual Report on Form 10-K for the fiscal year ended May 31, 2010).* | |||||||
| 10.2 | Form of Restricted Stock Agreement for non-employee directors under the 1990 Stock Incentive Plan (incorporated by reference to Exhibit 10.4 to the Company’s Annual Report on Form 10-K for the fiscal year ended May 31, 2014).* | |||||||
| 10.3 | Form of Non-Statutory Stock Option Agreement for options granted to executives under the Stock Incentive Plan (incorporated by reference to Exhibit 10.1 to the Company’s Quarterly Report on Form 10-Q for the fiscal quarter ended February 28, 2018).* | |||||||
2023 FORM 10-K 93
Table of Contents
| 10.4 | Form of Indemnity Agreement entered into between the Company and each of its officers and directors (incorporated by reference to Exhibit 10.2 to the Company’s Annual Report on Form 10-K for the fiscal year ended May 31, 2008).* | ||||
| 10.5 | NIKE, Inc. 1990 Stock Incentive Plan (incorporated by reference to Exhibit 10.7 to the Company’s Annual Report on Form 10-K for the fiscal year ended May 31, 2014).* | ||||
| 10.6 | NIKE, Inc. Deferred Compensation Plan (Amended and Restated effective April 1, 2013) (incorporated by reference to Exhibit 10.9 to the Company’s Annual Report on Form 10-K for the fiscal year ended May 31, 2013).* | ||||
| 10.7 | NIKE, Inc. Deferred Compensation Plan (Amended and Restated effective June 1, 2004) (applicable to amounts deferred before January 1, 2005) (incorporated by reference to Exhibit 10.6 to the Company’s Annual Report on Form 10-K for the fiscal year ended May 31, 2004).* | ||||
| 10.8 | Amendment No. 1 effective January 1, 2008 to the NIKE, Inc. Deferred Compensation Plan (June 1, 2004 Restatement) (incorporated by reference to Exhibit 10.9 to the Company’s Annual Report on Form 10-K for the fiscal year ended May 31, 2009).* | ||||
| 10.9 | NIKE, Inc. Foreign Subsidiary Employee Stock Purchase Plan (incorporated by reference to Exhibit 10.1 to the Company’s Quarterly Report on Form 10-Q for the fiscal quarter ended November 30, 2008).* | ||||
| 10.10 | Amended and Restated Covenant Not to Compete and Non-Disclosure Agreement between NIKE, Inc. and Mark G. Parker dated July 24, 2008 (incorporated by reference to Exhibit 10.1 to the Company’s Current Report on Form 8-K filed July 24, 2008).* | ||||
| 10.11 | Form of Restricted Stock Unit Agreement under the Stock Incentive Plan (incorporated by reference to Exhibit 10.2 to the Company’s Quarterly Report on Form 10-Q for the fiscal quarter ended February 28, 2018).* | ||||
| 10.12 | Form of Covenant Not to Compete and Non-Disclosure Agreement between NIKE, Inc. and its executive officers (other than Mark G. Parker and John J. Donahoe II) (incorporated by reference to Exhibit 10.1 to the Company’s Current Report on Form 8-K filed February 18, 2020).* | ||||
| 10.13 | Policy for Recoupment of Incentive Compensation (incorporated by reference to Exhibit 10.3 to the Company’s Current Report on Form 8-K filed July 20, 2010).* | ||||
| 10.14 | NIKE, Inc. Stock Incentive Plan (incorporated by reference to Exhibit 10.2 to the Company’s Current Report on Form 8-K filed September 23, 2015).* | ||||
| 10.15 | Form of Discretionary Performance Award Agreement (incorporated by reference to Exhibit 10.22 to the Company’s Annual Report on Form 10-K for the fiscal year ended May 31, 2018).* | ||||
| 10.16 | NIKE, Inc. Amended and Restated Long-Term Incentive Plan (incorporated by reference to Exhibit A to the Company’s definitive Proxy Statement filed July 25, 2017).* | ||||
| 10.17 | Offer Letter between NIKE, Inc. and John J. Donahoe II (incorporated by reference to Exhibit 10.1 to the Company’s Current Report on Form 8-K filed October 22, 2019).* | ||||
| 10.18 | Form of Covenant Not to Compete and Non-Disclosure Agreement between NIKE, Inc. and John J. Donahoe II (incorporated by reference to Exhibit 10.3 to the Company’s Current Report on Form 8-K filed October 22, 2019).* | ||||
| 10.19 | Form of Performance-Based Stock Option Agreement (incorporated by reference to Exhibit 10.2 to the Company’s Current Report on Form 8-K filed October 22, 2019). | ||||
| 10.20 | Letter Agreement between NIKE, Inc. and Mark G. Parker (incorporated by reference to Exhibit 10.6 to the Company’s Current Report on Form 8-K filed October 22, 2019).* | ||||
| 10.21 | NIKE, Inc. Executive Performance Sharing Plan (incorporated by reference to Exhibit 10.1 to the Company’s Current Report on Form 8-K filed June 19, 2020).* | ||||
| 10.22 | NIKE, Inc. Amended and Restated Long-Term Incentive Plan (incorporated by reference to Exhibit 10.2 to the Company’s Current Report on Form 8-K filed June 19, 2020).* | ||||
| 10.23 | Form of Non-Statutory Stock Option Agreement under the NIKE, Inc. Stock Incentive Plan (incorporated by reference to Exhibit 10.3 to the Company’s Current Report on Form 8-K filed June 19, 2020).* | ||||
| 10.24 | Form of Restricted Stock Unit Agreement under the NIKE, Inc. Stock Incentive Plan (incorporated by reference to Exhibit 10.4 to the Company’s Current Report on Form 8-K filed June 19, 2020).* | ||||
| 10.25 | NIKE, Inc. Stock Incentive Plan (incorporated by reference to Exhibit 10.1 to the Company’s Current Report on Form 8-K filed September 18, 2020).* | ||||
| 10.26 | NIKE, Inc. Performance-Based Restricted Stock Unit Agreement under the NIKE, Inc. Stock Incentive Plan (incorporated by reference to Exhibit 10.1 to the Company’s Current Report on Form 8-K filed on June 17, 2021).* | ||||
| 10.27 | Credit Agreement, dated as of March 11, 2022, among NIKE, Inc., Bank of America, N.A., as Administrative Agent, and the other Banks named therein (incorporated by reference to Exhibit 10.2 to the Company’s Current Report on Form 8-K filed March 14, 2022). | ||||
| 10.28 | NIKE, Inc. Employee Stock Purchase Plan, as amended (incorporated by reference to Exhibit 10.1 to the Company’s Current Report on Form 8-K filed on September 14, 2022). | ||||
| 10.29 | Credit Agreement, dated as of March 10, 2023, among NIKE, Inc., Bank of America, N.A., as Administrative Agent, and the other Banks named therein (incorporated by reference to Exhibit 10.1 to the Company’s Current Report on Form 8-K filed March 13, 2023). | ||||
| 21 | Subsidiaries of the Registrant. | ||||
| 23 | Consent of PricewaterhouseCoopers LLP, Independent Registered Public Accounting Firm (included within this Annual Report on Form 10-K). | ||||
| 31.1 | Rule 13a-14(a)/15d-14(a) Certification of Chief Executive Officer. | ||||
| 31.2 | Rule 13a-14(a)/15d-14(a) Certification of Chief Financial Officer. | ||||
| 32† | Section 1350 Certifications. | ||||
2023 FORM 10-K 94
Table of Contents
| 101.INS | Inline XBRL Instance Document – the instance document does not appear in the Interactive Data File because its XBRL tags are embedded within the Inline XBRL document. | ||||
| 101.SCH | Inline XBRL Taxonomy Extension Schema | ||||
| 101.CAL | Inline XBRL Taxonomy Extension Calculation Linkbase | ||||
| 101.DEF | Inline XBRL Taxonomy Extension Definition Document | ||||
| 101.LAB | Inline XBRL Taxonomy Extension Label Linkbase | ||||
| 101.PRE | Inline XBRL Taxonomy Extension Presentation Linkbase | ||||
| 104 | Cover Page Interactive Data File – formatted in Inline XBRL and included in Exhibit 101 | ||||
* Management contract or compensatory plan or arrangement.
† Furnished herewith
The Exhibits filed herewith do not include certain instruments with respect to long-term debt of NIKE and its subsidiaries, inasmuch as the total amount of debt authorized under any such instrument does not exceed 10 percent of the total assets of NIKE and its subsidiaries on a consolidated basis. NIKE agrees, pursuant to Item 601(b)(4)(iii) of Regulation S-K, that it will furnish a copy of any such instrument to the SEC upon request.
2023 FORM 10-K 95
Table of Contents
SCHEDULE II — VALUATION AND QUALIFYING ACCOUNTS
| (Dollars in millions) | BALANCE AT BEGINNING OF PERIOD | CHARGED TO COSTS AND EXPENSES | CHARGED TO OTHER ACCOUNTS(1) | WRITE-OFFS, NET | BALANCE AT END OF PERIOD | ||||||||||||
| Sales returns reserve | |||||||||||||||||
| For the fiscal year ended May 31, 2021 | $ | 682 | $ | 2,617 | $ | 41 | $ | (2,745) | $ | 595 | |||||||
| For the fiscal year ended May 31, 2022 | 595 | 2,573 | (31) | (2,612) | 525 | ||||||||||||
| For the fiscal year ended May 31, 2023 | 525 | 3,344 | (11) | (3,309) | 549 | ||||||||||||
(1)Amounts included in this column primarily relate to foreign currency translation.
2023 FORM 10-K 96
Table of Contents
ITEM 16. FORM 10-K SUMMARY
None.
2023 FORM 10-K 97
Table of Contents
Consent of Independent Registered Public Accounting Firm
We hereby consent to the incorporation by reference in the Registration Statements on Form S-3 (No. 333-266267) and Form S-8 (Nos. 033-63995, 333-63581, 333-63583, 333-68864, 333-68886, 333-71660, 333-104822, 333-117059, 333-133360, 333-164248, 333-171647, 333-173727, 333-208900, 333-215439 and 333-266269) of NIKE, Inc. of our report dated July 20, 2023 relating to the financial statements, financial statement schedule and the effectiveness of internal control over financial reporting, which appears in this Form 10-K.
/s/ PricewaterhouseCoopers LLP
Portland, Oregon
July 20, 2023
2023 FORM 10-K 98
Table of Contents
SIGNATURES
Pursuant to the requirements of Section 13 or 15(d) of the Securities Exchange Act of 1934, the registrant has duly caused this report to be signed on its behalf by the undersigned, thereunto duly authorized.
| NIKE, INC. | ||||||||
| By: | /s/ JOHN J. DONAHOE IIJohn J. Donahoe IIPresident and Chief Executive Officer | |||||||
| Date: | July 20, 2023 | |||||||
Pursuant to the requirements of the Securities Exchange Act of 1934, as amended, this report has been signed below by the following persons on behalf of the registrant and in the capacities and on the dates indicated.
| SIGNATURE | TITLE | DATE | ||||||
| PRINCIPAL EXECUTIVE OFFICER AND DIRECTOR: | ||||||||
| /s/ JOHN J. DONAHOE IIJohn J. Donahoe II | President and Chief Executive Officer | July 20, 2023 | ||||||
| PRINCIPAL FINANCIAL OFFICER: | ||||||||
| /s/ MATTHEW FRIENDMatthew Friend | Executive Vice President and Chief Financial Officer | July 20, 2023 | ||||||
| PRINCIPAL ACCOUNTING OFFICER: | ||||||||
| /s/ JOHANNA NIELSEN Johanna Nielsen | Vice President and Corporate Controller | July 20, 2023 | ||||||
| DIRECTORS: | ||||||||
| /s/ MARK G. PARKERMark G. Parker | Director, Chairman of the Board | July 20, 2023 | ||||||
| /s/ CATHLEEN A. BENKOCathleen A. Benko | Director | July 20, 2023 | ||||||
| /s/ TIMOTHY D. COOKTimothy D. Cook | Director | July 20, 2023 | ||||||
| /s/ THASUNDA B. DUCKETTThasunda B. Duckett | Director | July 20, 2023 | ||||||
| /s/ MÓNICA GILMónica Gil | Director | July 20, 2023 | ||||||
| /s/ ALAN B. GRAF, JR.Alan B. Graf, Jr. | Director | July 20, 2023 | ||||||
| /s/ MARIA HENRYMaria Henry | Director | July 20, 2023 | ||||||
| /s/ PETER B. HENRYPeter B. Henry | Director | July 20, 2023 | ||||||
| /s/ TRAVIS A. KNIGHTTravis A. Knight | Director | July 20, 2023 | ||||||
| /s/ MICHELLE A. PELUSOMichelle A. Peluso | Director | July 20, 2023 | ||||||
| /s/ JOHN W. ROGERS, JR.John W. Rogers, Jr. | Director | July 20, 2023 | ||||||
| /s/ ROBERT SWANRobert Swan | Director | July 20, 2023 | ||||||
2023 FORM 10-K 99


